URA, I'll buy the dips (informational purposes only!)buy the Uranium URA dips we may see $24-$25 first, but if $25.40 holds we should continue upwards next week
URA trade ideas

$URA Uranium on the move!Triple MACD hidden bullish divergence, Hidden divergence on the RSI on the backtest, and on the move. Very strong accelerating volume trend as we approach the bullish control zone.

Global X Uranium ETF - Target Met +19%Original idea attached.
Global X Uranium ETF (URA) - Target of $25.90 has been met.
Gain +19.7% over the 3 weeks.
Just some related news in the last few minutes before the US market close:
U.S. WEIGHS SANCTIONS ON RUSSIAN NUCLEAR POWER SUPPLIER ROSATOM

Russia did itRussia is "Putin" this long call play into my lap. I see 24 and then a rally towards 30


Global X Uranium ETFI wrote about the Uranium sector 14-months ago on 07-December 2020 when the ETF traded at $14. The move over the period has been strong, with a high of $31.60 on 09 November 2021.
I looked the attached chart last night and thought there were some interesting similarities to prior periods.
STRATEGY: PENDING BULL FLAG BREAKOUT + TIME CYCLE
Key Trading Levels For Buy/Long Opportunity
The highlighted levels may or may not trigger during the upcoming trading session.
Blue Lines = Bullish Reversal Pivot
Required: Needs to hold above the pivot with intraday strong bids.
TF = Medium Term

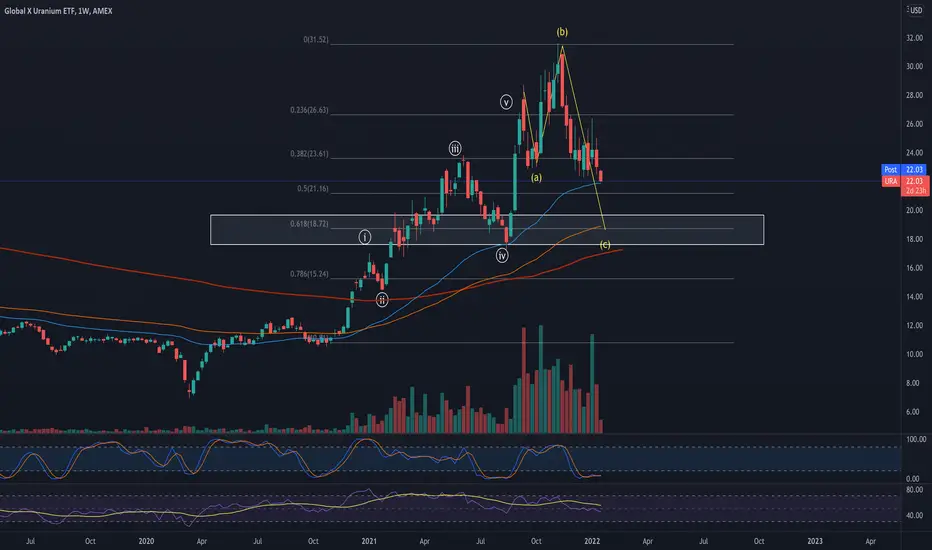
URA - Going All The Way Home 🦧Got quite a frosty reception on this short when I called the top on this one back in September.
Clearly some longs thought there were still plenty of bananas left in the trees.
And how wrong they were.
URA now looks to have completed a primary B wave rejecting from the 50DMA. Now in consideration that indexes look set to move up this rejection could itself be an intermediete B or X wave depending on the type of correction that could still see URA break the 50DMA up to $26.
I am leaning towards the more simple collapse in this areas at the 50DMA.
But either way it will ultimately prove to be a dead cat bounce.
Weekly RSI will go oversold before this is worth even considering as a buy.
Current target is $14, may overshoot to $12
Not advice.

Uranium - Is it getting ready for yet another rally? Over the past two years, the uranium sector has been experiencing a deficit on the supply side which led to a surge of more than 300% in the price of Global X Uranium ETF. The situation was even further exacerbated when in January 2022 Kazakhstan, world's largest producer, saw civil unrest spreading across the country. We foresee the deficit in the uranium market to be persistent throughout the whole year 2022 which we expect to have a positive impact on the price of this yellow metal. Recently, URA ETF saw bullish developments taking place on the daily time frame which possibly sets it for another rally.
Top ten biggest producers of uranium by country (2020):
1. Kazakhstan = 19 477 tonnes (approximately 41% of world supply)
2. Australia = 6 203 tonnes
3. Namibia = 5 413 tonnes
4. Canada = 3 885 tonnes
5. Uzbekistan = 3 500 tonnes
6. Niger = 2 991 tonnes
7. Russia = 2 846 tonnes
8. China = 1 885 tonnes
9. Ukraine = 744 tonnes
10. India = 400 tonnes
Meanwhile, the U.S. produced only 6 tonnes of uranium in 2020 which leaves it heavily dependent on foreign producers.
Technical analysis - daily time frame
RSI is very bullish. MACD is bullish, though it still remains in the bearish territory. Stochastic is bullish. DM+ and DM- performed bullish crossover recently. However, ADX contains low value which suggests no trend is currently present in URA. Overall, the daily time frame is bullish.
Illustration 1.01
Picture above depicts the daily chart of the URA ETF. It also shows resistance at slope. We will observe price action closely and we will look whether it manages to break above the resistance. If breakout occurs, then we expect such a phenomenon to strongly bolster the bullish case for the URA ETF.
Technical analysis - weekly time frame
RSI continues to develop bearish structure. However, it already reversed which is bullish. We will watch whether it will manage to break its bearish structure. MACD is bearish but it shows first signs of flattening. Stochastic oscillates in the bearish territory, however, it points to the upside at the moment. DM+ and DM- show bearish conditions in the market. ADX suggests a lack of prevailing trend. Overall, the weekly time frame is bearish but signals very weak or no trend at all.
Support and resistance
Major resistance lies at 31.60 USD. Short-term resistance sits at 23.26 USD. Resistance 1 is at 26.37 USD and Resistance 2 at 28.72 USD. Resistance 3 is at 29.77 USD. Short-term support sits at 21.72 USD. Support 2 can be found at 17.23 USD.
Please feel free to express your own ideas and thoughts in the comment section.
DISCLAIMER: This analysis is not intended to encourage any buying or selling of any particular securities. Furthermore, it should not serve as a basis for taking any trade action by an individual investor. Your own due diligence is highly advised before entering trade.

URA Weekly 2022-02-06As per the Elliott wave Count and the completion of the a,b,c,d,e Megaphone which at Support ,the Fib Model of predictive Calculations all correspond at Price advancing to 37,83

CTS - URANIUMUranium is far from its historical 137, it is clean energy
with less cost of lives and more efficient today.
Politics: Increasing openness and acceptance in the USA, China, Europe and Japan
Supply: Supply has increased linearly, rare earth discovery
in the Middle East
Demand: As regulations continue to relax, uranium and
mareomotris is the only source of energy with realistic possibilities to overcome the
oil in energy for $

$URA daily chart the selling continues.. #uranium once these flows reverse we may have hit the bottom.

$URA weekly chart uranium rotationoil money rotated into natgas and we saw some massive gains this week. 2000% on our UNG calls.
everyone is ignoring uranium just like they did natural gas. this whole russia debacle is about ENERGY not oil.
if it costs more to produce electricity via natural gas , uranium will become more profitable as its at these lows.
simple supply and demand

$URA first oil....... thenfirst oil then nat gas... then i thot utilities??? just because the cost goes up doesnt mean the price goes up.... if x cost 20 to power normally and now costs 30, how much does z cost to power when costing 20 normally but now cost 15...
simple example for uranium.... nucLEAR is our friend

URACount on URA looks like 5 up followed by an irregular top which in EW terms means that after 5up impulsive waves complete the correction ensues but wave A falls short to correct the prior impulsive move then the B wave over shoots the top of wave 5 in an irregular top, the C wave that follows should be 5 down and make up for the A wave which was small in % compared to the trend. C wave should retrace to 618% fib lvl around $18
URA: Buying The Dip on Boomer StocksThis is the year for my boomer friends to buy the dip on their favorite long time value stocks and commodities. That being said, it appears we have Wyckoff Accumulation happening on Uranium. I'm noticing a lot of dip buying with Pleiades bands widening to the buy side while we are chopping sideways.
I could see one last shakeout (or Spring) to allow the stock’s dominant players to make a definitive test of available supply before a markup campaign unfolds into March.
Short Term downside shakeout targets
23, 22.72, 22.26, 21.60
Longer Term upside targets
27.60, 31.20, 35.11, 40.72
Catalysts
1.) Saudi Arabia to develop 'huge' uranium resources in energy diversity push
www.spglobal.com
2.) Demand from other countries may increase for energy alternatives as price for oil, natural gas, and other commodities keep going up with inflation.
school.stockcharts.com
www.world-nuclear.org

Higher Uranium prices?It doesn't have to be the situation in Kazakhstan that is causing uranium prices to rise. The media are currently raising the issue of nuclear energy in a positive context to renewable energy

Urally Need To See ThisUranium is poised for a move. Charts show demand is ramping up and supply is slow to catch it as world leaders slowly catch on to it's inevitable necessity. As long as commodities hold up, URA should stay on trend and begin to take it's next leg up from the bottom of the channel.
Should prices break down, it could mean a plunge lower to the fib retracement levels. Sooner or later though, the yellow cake wants to go to 66

URA Bullish Trend AnalysisAre we seeing the beginning of an inverse head & shoulders pattern? I strongly agree the fundamentals of uranium are already pointing towards bullish momentum for the new year. We are possibly getting ready for another impulse move.

$URA, not too late to the party tradethe price bounced back two times from the 0.618 fib level;
previous retrace was also around 28%; we will see one another 80% increase?
if you are looking for a mid term trade, there is a 3 to 1 RRR;
nuclear power is getting more attention; also the technology around it is getting better.

URA- D1 - DOUBLE BOTTOM IN PROGRESS !MEDIUM / LONG TERM BUYING OPPORTUNITY WITH A STRONG STORY BEHIND !!!
BUY AT CURRENT LEVEL AND ADD ON DIPS.
MEDIUM/LONG TERM TARGET : $ 37.05 - $ 55.68 - $ 70.73
DAILY (D1) :
Yesterday's price action triggered a potential double bottom formation in progress coupled with a RSI bullish divergence.
In addition, the daily closing price (@24.30) is above the Tenkan-Sen (@ 24.14)
An upside breakout of $25.85 (double bottom trigger level) & 38.2% Fib retracement, would activate this ongoing formation (DB) in opening the door for a technical target of $ 29.27,
which is also, by the way, roughly the top level of the daily clouds resistance area.
WEEKLY (W1) :
Recent price action from the top ($31.60) is an healthy consolidation move in a broad bull trend still in place.
Indeed, the primary uptrend support line is still intact and is also coinciding with the weekly clouds support area.
In addition, the 61.8% Fibonacci retracement @ 22.72 has been filled (with an intraweek low @ 22.43.
A weekly closing above KS and Mid Bollinger Band, respectively @ 24.42 and 24.52 would add further support for further upside towards, firstly the TS, currently ƒ 27.02 ahead of 29.27
technical double bottom target above mentioned.
Interesting to note that the 29.27 level coincides also with the middle of the long black candle which triggered this consolidation move.
A weekly closing above 29.27 would be seen as a very positive signal, calling for a retest of former high @ 31.60 ahead of higher level
MONTHLY (M1) :
Uptrend intact, above the monthly clouds, above the Kijun-Sen and the Mid Bollinger band.
Watch the Lagging line which after having broken the clouds is again inside the clouds.
A new upside breakout of the clouds would also add further support for higher levels.
As you can see on this monthly chart, there is plenty of space to the upside and my strategic technical target
are the following :
Target 1 : 31.60
Target 2 : 37.05
Target 3 : 55.68
Target 4 : 70.73
For your information, there is also another vehicle investment in this URANIUM theme and on my view it is the best one :
Strategy Certificate sur U3O8 RENAISSANCE Portfolio
Sous-jacent: U3O8 RENAISSANCE Portfolio
Catégorie de produit ASPS/EUSIPA Tracker Certificates (1300)
ISIN: CH0441692628 /Valor: 44169262
Last price (December 15th 2021)
$ 1879.31 - $ 1898.29
Ironman8848 & Jean-Pierre Burki

URA - Multiyear Top Is InApparently there's some hubbub by some reddit apes of wild things happening in Uranium so I thought I'd make this URA thread.
Just to say that it has topped.
And any bounce to $26 and I'll short it.
Target: somewhere or other, we'll see.
Not advice.

Long $URA CMP $28.47Long $URA CMP $28.47. Hot sector. Very high volume yesterday. May test trendline support from break out. MACD turned positive. Forming cup and handle pattern. Price support ~$23-24. Resistance ~$28-29. Target $35. Stop loss ~$23 area. Risk to reward 1:1

Closed: URA December 17th 28/28/38 Iron Fly... for a 3.63 debit.
Comments: In for 4.84 (See Post Below), out of the short straddle aspect and the long call for 3.63 today, a 1.21 ($121) profit. The 18 long put was no bid, but I've entered an order to close it if someone will take it off of my hands for .05. Otherwise, I'll just let it expire worthless.
