ABNB updateWe could be looking at 120$ retest, could be seeing an good drop here back to 80-100$ area. In my previous ideas I talked about how ABNB will have it's downfall by the end of 2023, it'll high likely still happen as the current pumping is likely because of good news for the market but it's not long term good.
ABNB trade ideas

$ABNB with the 2-2-2u reversal on the daily$ABNB with the 2-2-2u reversal on the daily, gap fill and close above the 9MEA, heading into to earnings.
Calls over $116.42
Target $119.28
Puts under $109.81
Target $106.54

AbnbAirbnb, Inc.
Here's to brighter days folks! Congratulations to all who knows what to know!!
Another stikstockitslive algorithm play succeeded.
=StikStockITSLIVE

AirBNB : WeakThe SuperBowl day news sums it up.
"A manager of 95 Phoenix Airbnbs is stunned that half his homes are empty over Super Bowl weekend. Is it the latest Airbnbust?"
14th Feb is the earnings day.
Mcap 70 bn
Looks Very weak.

ABNB Airbnb Options Ahead of EarningsAfter my price target was reached:
If you too have an Airbnb I think you noticed how your bookings declined YoY.
That will be reflected in the company`s earnings as well.
Now looking at the ABNB Airbnb options chain ahead of earnings , I would buy the $105 strike price Puts with
2023-7-21 expiration date for about
$11.15 premium.
If the options turn out to be profitable Before the earnings release, I would sell at least 50%.
The longer timeframe allows me more flexibility in case of a small rally after the CPI report.
Looking forward to read your opinion about it.

$ABNB stalled, negative backdrop, long term winner$ABNB stalled with a negative fundamental back drop over the next few years. Theory is that growth has peaked short term but a long term name I like.

Airbnb: Vacation Ready 🌴🌞After finishing up the turquoise wave 1, the Airbnb stock should get some rest and drop into a correction to reach the turquoise target zone between $101.66 and $90.36. Within this zone, we expect the corrective low of the turquoise wave 2, which is followed by an upwards trend back North. Our alternative scenario with a probability of 35% implies, that the course could drop below the support line at $81.91 and continue with a downwards slope until hitting the low of the grey wave alt. II in the grey target zone.

ABNB- BULLISH SCENARIOAirbnb stock has intrigued investors in growth stocks since its Nasdaq debut in December 2020. From its initial public offering price of $68 per share, ABNB stock soared as much as 223%, hitting an all-time high of 219.94. Since then, the share price has tumbled about 52%.
Last week we witnessed a breakout of the major resistance level which triggered new buys and a bullish impulse to the $ 130 resistance.
Risk Disclosure: Trading Foreign Exchange (Forex) and Contracts of Difference (CFD's) carries a high level of risk. By registering and signing up, any client affirms their understanding of their own personal accountability for all transactions performed within their account and recognizes the risks associated with trading on such markets and on such sites. Furthermore, one understands that the company carries zero influence over transactions, markets, and trading signals, therefore, cannot be held liable nor guarantee any profits or losses.

$ABNB Bullish Dragon / CypherAnother common pattern ive been seeing across the market is the Bullish dragon with the lower low on C which would give me the impression that we could see a 786 return. In the case of a double bottom, we would look for a target a bit higher at the 2.0 extension around the 886, which would end up being a Bearish Shark, rather than the cypher here.

ABNB Rangebound$ABNB has been trading in this range since September and it looks like it's getting ready to breakout.
Regardless if it is ready or not, just play the range.

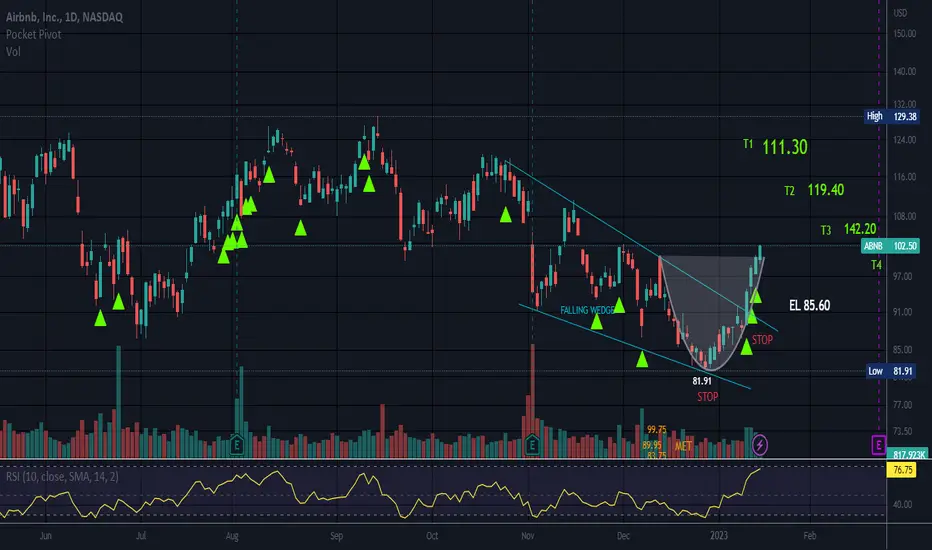
Falling WedgePrice appears to have broken up from a rising wedge which can be a bullish chart pattern. Falling wedges are usually found after a deep pull back or at the bottom.
The structure slopes down with the trend and the lines narrow at the apex.
Cup is forming. I do not see a handle.
ATL 81.91 ATH 219.94.
No recommendation.
RSI is at 76.97 and is set on 80 versus 70.
Airbnb, can you double you money? Massive double topsPrice has been falling since November 2021, no signs of turning back up, and massive bearish patterns on all timeframes. Most likely to keep falling along the descending channel. TP $50 (why not?). SP outside the channel and wide. I'll hold this one 3 or 4 months.

ABNB close to our price targetIf you haven`t sold at $148 when i warned you about the high valuation:
Then you must know that ABNB Airbnb will close its business in China because of strong competition with local operators.
My price target is still $95.
Looking forward to read your opinion about it.

Bias more on upside for ABNB8th Jan 2023
Everyone can't wait to travel. 2023 is a good sign to relook into travel, hotel and accommodation industry.
With China reopens borders, there may be a surge in term of sales for these sectors.
TP: 100
SL: 82

Airbnb Inc Fib Triangle Airbnb is in a long-term triangular formation where market will correct itself continuously, a strugle of bulls and bears and shaping patterns.
Buying: inside cold colors hitting Fib lines and at breakout from top downward line.
Selling: inside hot colors touching Fib lines and once price is breaking below bottom support line.
Personally, I'm bullish on this one, without thinking about selling.

AIRBNB - BULLISH SCENARIOAlthough the company's growth rate has been slowing down in recent quarters,
Airbnb`s business fundamentals remain solid.
For the period ending Sept. 30, 2022, Airbnb's sales totaled $2.9 billion and rose roughly 29% year over year.
Also, the company reported $7.5 billion of cash and cash equivalents at the end of the quarter
The first resistance is located at $ 98.
Risk Disclosure: Trading Foreign Exchange (Forex) and Contracts of Difference (CFD's) carries a high level of risk. By registering and signing up, any client affirms their understanding of their own personal accountability for all transactions performed within their account and recognizes the risks associated with trading on such markets and on such sites. Furthermore, one understands that the company carries zero influence over transactions, markets, and trading signals, therefore, cannot be held liable nor guarantee any profits or losses.

Airbnb IPO - Will it have a price halvingI've seen a lot of IPO's that almost immidiately halve in price after the IPO, then promptly put a nice W in and then turn back up.. so Im making a prediction that something like that will happen here. Very curious to see what happens.

ABNB falling wedge Long IdeaABNB is forming a falling wedge on the daily chart holding and bouncing off lower trendline support.
MACD and RSI are also showing positive confluence

ABNB Massive LevelIf ABNB manages to get above the 86.75 level, we should see a pretty nice rally opportunity!

ABNBNot financial advice.
The essence of investing & trading is the intelligent and patient preying on the greed, fear, impatience, addiction and ignorance of the majority. It's definitionally Darwinian.

airbnb is long for long time airbnb is in terminal as C of zigzag , for now we are in end of wave 3 of this terminal


AITBNB - Possible Long OpportunityABNB is showing signs of strength still to be confirmed if the stock breaks above the resistance line.
Divergence in RSI, OBV in both daily and weekly charts.
entry could be possible at this level with stop loss around 85-87.
Free Cash Flow around $1B.
*Not financial advice, do your own research and let me know what you think.
Thanks,
Sam
