BUY $GOLD - NR Picks Ene 03ES:
Barrick Gold Corporation se dedica a la exploración, desarrollo minero, producción y venta de propiedades de oro y cobre. Tiene participaciones en la producción de minas de oro ubicadas en Argentina, Canadá, Costa de Marfil, República Democrática del Congo, República Dominicana, Malí, Papua Nueva Guinea, Tanzania y Estados Unidos. La empresa también tiene participaciones en la producción de minas de cobre ubicadas en Chile, Arabia Saudita y Zambia; y varios otros proyectos ubicados en las Américas. Tiene un acuerdo de alianza estratégica con Reunion Gold Corporation. Barrick Gold Corporation fue fundada en 1983 y tiene su sede en Toronto, Canadá.
Fundamentos:
- 3.5% por debajo de su valor real
- P/E 13.7x vs 14.8x Industria
- P/B 1.8x vs 2.9x Industria
Técnicos:
- RSI < 50
- 10% por debajo de MA 200
El oro es visto como un activo refugio y meses atrás cuando lo mercados estaban muy volátiles, muchos inversores decidieron iniciar posición en acciones relacionadas. Haciendo que en agosto toque nuevos niveles de máximos históricos desde ese momento ha resistido bastante bien los $1800 y gracias a este desempeño ha permitido que empresas relacionadas acumulen efectivo para aligerar su carga financiera. Cabe resaltar que GOLD en cuanto a sus ratios fundamentales es una de las más sostenibles de la industria.
Si bien es cierto el mercado las últimas semanas ha marcado una tendencia alcista creemos que la volatilidad permanecerá por los siguientes meses.
EN:
Barrick Gold Corporation is engaged in the exploration, mining development, production and sale of gold and copper properties. It has interests in the production of gold mines located in Argentina, Canada, the Ivory Coast, the Democratic Republic of the Congo, the Dominican Republic, Mali, Papua New Guinea, Tanzania and the United States. The company also has interests in the production of copper mines located in Chile, Saudi Arabia and Zambia; and several other projects located in the Americas. It has a strategic alliance agreement with Reunion Gold Corporation. Barrick Gold Corporation was founded in 1983 and is based in Toronto, Canada.
Fundamentals:
- 3.5% below its real value
- P / E 13.7x vs 14.8x Industry
- P / B 1.8x vs 2.9x Industry
Technicians:
- RSI <50
- 10% Below de MA 200
Gold is seen as a safe haven asset and months ago when the markets were very volatile, many investors decided to initiate positions in related stocks. Making it touch new levels of historical highs in August since then, it has withstood the $ 1800 level quite well and thanks to this performance it has allowed related companies to accumulate cash to lighten their financial burden. It should be noted that GOLD in terms of its fundamental ratios is one of the most sustainable in the industry.
Although it is true that the market in recent weeks has marked an upward trend, we believe that volatility will remain for the following months.
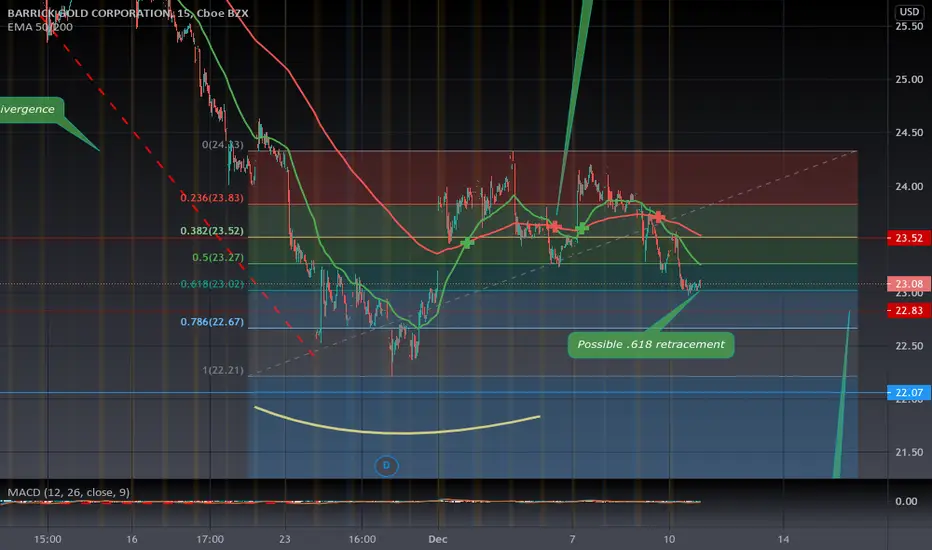
ABX trade ideas

GOLD Barrick: Divergence-> left turn? -Divergence of RSI MACD STOCH against the general downward trend, similar to late 2018,
-lows holding, highs descending between 32%and50% RT
-similar to 2018, same as gdx
-ONE dirty dirty DIRTY heart crushing gap from the Spring rebound (not on chart)
I'm like NASCAR, left turns only please.

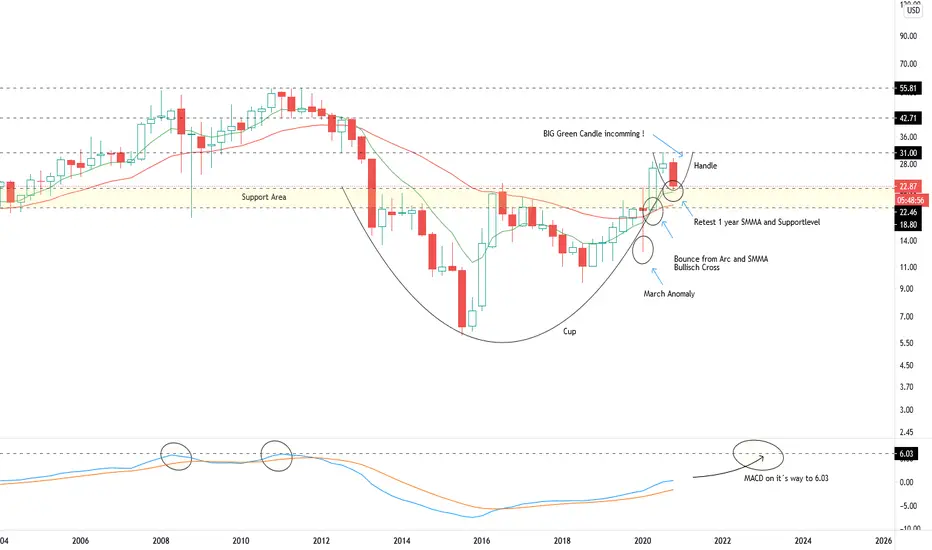
Barrick Gold Corp.Bullish Cup and Handle Pattern
I expect a big green 3 Month Candle with a minimum 31 $ target for Q1 2021
GOLD (BARRICK) before a 75% increase.GOLD (BARRICK) before a 75% increase. The analysis shows that the price movement of Barrick shares around the wave axis has become symmetric. This suggests two things. 1. The calculation of the wave axis is in a good place :) 2. The price movement has reached the strong support level (since this level is the minimum level of the wave amplitude) so I assume the price movement starts to rise. It can also be seen that an accumulation movement has also developed in this correction range, so further upward movement is expected. If I consider the fractal rules, then apparently the fractal formed on the symmetry axis can be further built. My final conclusion in the price movement is a rising wave sequence with a target price of 40 usd.


Barrick Gold to bottom out at $21.95Barrick Gold has room to cross its resistance at $22.90 and continue its down trend to $21.95. OBV continues to go down as well, indicating no reversal at this stage. An uptrend is confirmed as soon as the Renko block crosses SMA10 and OBV indicates an uptrend. Looking forward to your comments.
About Renko Charts
A Renko chart is a type of chart, developed by the Japanese, that is built using price movement rather than both price and standardized time intervals like most charts are. It is thought to be named after the Japanese word for bricks, "renga," since the chart looks like a series of bricks. A new brick is created when the price moves a specified price amount, and each block is positioned at a 45-degree angle (up or down) to the prior brick. An up brick is green, while a down brick is red.


BARRICK GOLDBarrick Gold -$22.88 (+0.22%)
Fundamental: More stimulus is coming. especially with the 2k checks trumps demanding, that means more real inflation (fed reserves are not inflationary, stimmys are! - last stimmy cost the gov 300 Bil . This time is a higher amount, for a lower income bracket, so its reasonable to assume about the same amount ~ 300 bill more).
Regardless of the macro, boomers will pile into gold as a safe haven as a result of stimulus in the news.
Regardless of the economy gold companies are doing fantastic! most companies factor a price of gold < $1600. spot has been well north of this, reasonable to expect amazing returns for this company's earnings .
Very underbought now ( RSI sub 30 in november, currently sub 40 ). right now, its even cheaper making this a smart money play. Consider that Buffet had bought in august, and trimmed his position in november. what did he see? Now is the time for smart money to position.
Technical: back at a stable support level of $22.75. price has been hugging the yellow trend line since Aug 2018. trust the trend, not the fud.
note: gold miners follow the gold price. make sure to follow the gold price like a hawk. currently very sold since august, counter seasonal trends. if gold can break $1900, the bull trend will continue. end of a bull run or a bull flag? you decide, heres my chart:

BIg Buys are happening This final low confirmed my suspicions that this was an accumulation phase by large hedge funds. In my chart you will notice an area marked "springboard". Springs are nothing but shakeouts that happens within the Accumulation phase. The prices will fall below the Preliminary Support of the trading range only to reverse back above the trading range within a short time period. (Often referred as False Breakout) I have also marked a top trend line that if broken will confirm that this was in fact large institutional accumulation.

LONG - Barrick Gold - TSXBased on current support and resistance over the last couple months and other indicators, we should see another uptrend to around $35 to $40.
I would set a stop loss in case the trend does reverse but from the looks of it, it will be uptrend.

BTD on $GOLD $GLD $GDX $JNUG $GDXUWe got some good news on the Stim bill today but it hasn't passed FR FR yet.
The House and Senate will vote today on a roughly $900 billion pandemic relief package, with the White House saying President Donald Trump would sign it. The deal includes help for small businesses, the jobless and direct payments to most Americans. The bill that lawmakers will vote on will be attached to a $1.4 trillion measure to fund government operations through the end of the fiscal year. As part of the compromise needed to reach agreement, Democrats allowed a provision to be inserted that would prohibit the Federal Reserve from restarting a program supporting corporate bonds and small businesses due to expire Dec. 31. (no more ink/paper for Powell? )
GOLD- i talked about this a while back, I'm overall bullish on Gold/Gold miner because stimulus passed = more inflation = good for GOLD fundamentally.(yea i know, who cares)
$22.20 has been a nice buying opportunity for this company but you could use that area as stoploss as well.
Entry $22.20 area
Target $25.20
Target 2 $28.20
Stoploss 21.20

Last Chance to Sell $ABXS E L L - Get out now if you can before the new year.
Cause this stock is totally bearish, just look at the chart, all it says is , um meh.

Barrick Gold_WeeklyIf the 30 level on the weekly RSI hold it will mark a higher high meaning a continuation of the trend which started in Aug 2018. In case there's a sharp selloff similar to the one in March, there could be a chance to see even lower levels. Currently watching $18 to $20, ideally $15.50.


BARRICK GOLD LONG TERM LOOK - RISING CHANNEL Expected move to the monthly demand zone and channel support. Long term bounce and continuation of channel to follow.


Barrick Gold potential targetsBarrick Gold potential targets on the chart. Comment below and let me know your thoughts. Feel free to share your work. Thanks!


Barrick GOLD & GOLD/USD 1 year comparisonBarrick Gold (GOLD) reported 3rd Quarter September 2020 earnings of $.41 per share on revenue of $3.5 billion. P/E: 13.8, Div/Yield: 1.32, Market cap: $42B. Barrick Gold engages in the production and sale of gold and copper, as well as related activities such as exploration and mine development. It operates through the following segments: Barrick Nevada, Veladero, Pueblo Viejo, Lagunas Norte, Turquoise Ridge, Acacia, and Pascua-Lama. In December GOLD is building strength and it just so happened to bounce off GOLD/USD as a "support" on the comparison chart. As GOLD/USD value gains going into 2021, so will GOLD. I think GOLD is oversold and it shows that on the 1 year trend channel & rsi. I entered GOLD$23.5straddle at market close on Friday 12/4 because price action insurance is inexpensive. GOLD has an excellent Delta:Theta ratio = 25:1. Do your own due diligence, your risk is 100% your responsibility. You win some or you learn some. Consider being charitable with some of your profit to help humankind. Small incremental steps work : If you double a penny for a month it = $5,368,709. Good luck and happy trading friends...
*3x lucky 7s of trading*
7pt Trading compass:
Price action, entry/exit
Volume average/direction
Trend, patterns, momentum
Newsworthy current events
Revenue
Earnings
Balance sheet
7 Common mistakes:
+5% portfolio trades, risk management
Beware of analysts motives
Emotions & Opinions
FOMO : bad timing
Lack of planning & discipline
Forgetting restraint
Obdurate repetitive errors
7 Important tools:
Trading View app!, Brokerage UI
Accurate indicators & settings
Wide screen monitor/s
Trading log (pencil & graph paper)
Big organized desk
Reading books, playing chess
Sorted watch-list
Checkout my indicators:
Fibonacci VIP - volume
Fibonacci MA7 - price
pi RSI - trend momentum
www.tradingview.com


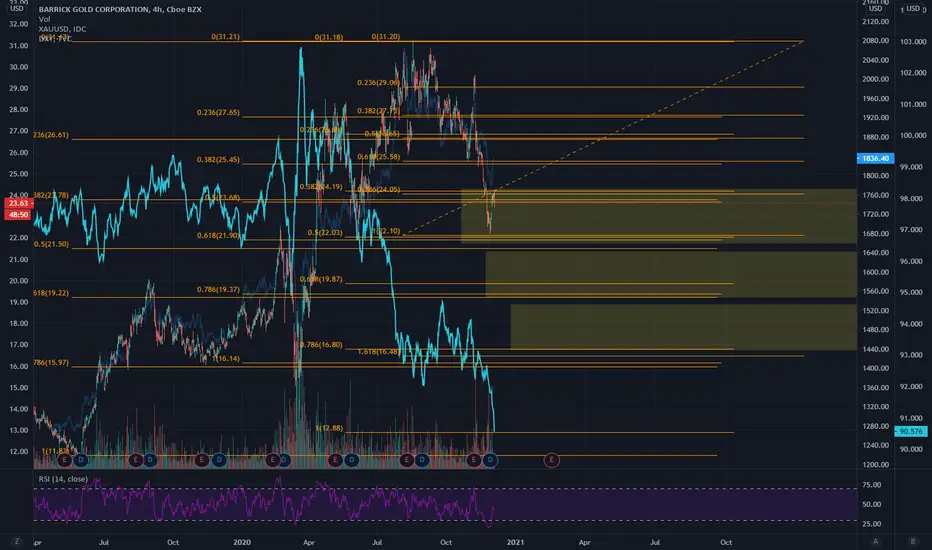
Barrick GoldShowing Barrick Gold in the Candles. Would like to see it show a bottom pattern before taking a long position.
Also shown in the white line graph is gold price. Gold and Barrick Price should Correlate.
Lastly is a line graph of DXY which seems to be tumbling. Typically gold is inversely correlated to dxy.
These times are intersing so lets see how it plays out.
Good luck.