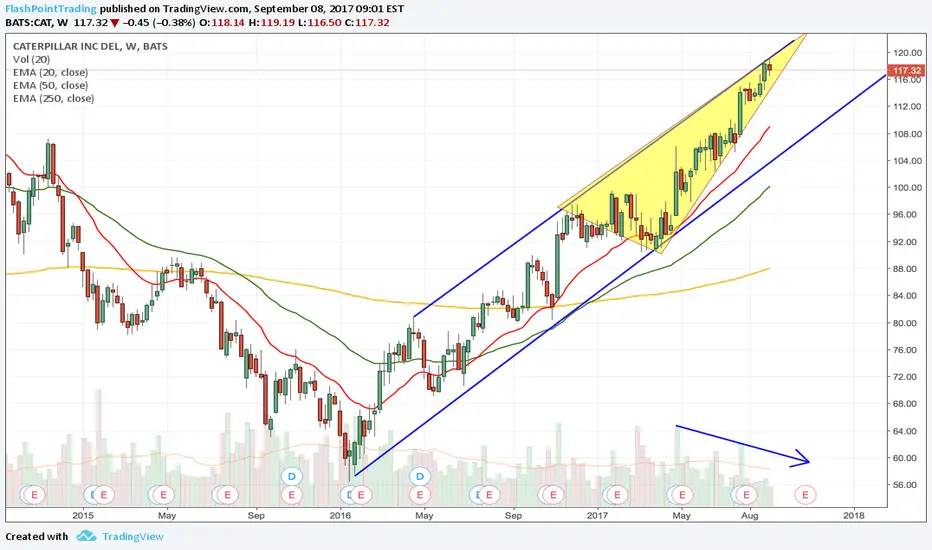
CAT Rising Wedge & Long Term ChannelCAT has more than doubled since 2016. Price action has taken the stock to its highest levels since 2013 even though revenue has remained relatively flat. Notice the Rising Wedge chart pattern which has reached the top of a Long Term Channel. Volume has been decreasing and other indicators suggest the stock is overbought. FlashPoint Trading is looking for an initial retracement to $110 with the potential for further weakness and price action below $100.
If you like our commentaty, please click like and follow us!
CAT trade ideas


CATWe are at a very strong resistance level as we have up move and average volume which is decreaisng. The last month is disbalanced, because the spread of the bar is wide and the volume is less compared to previous bar's spread and their activity. So it would be a good idea to buy put options.

CaterpillarWe are at a very strong resistance level as we have up move and average volume which is decreasing. The last month (July) was disbalanced, because the spread of the bar is wide and the volume is less compared to previous bar's spread and their activity. So it would be a good idea to buy put options.

Short Put - CATCash flow play here.
High IV in CAT due to earnings soon. $100 put is trading for $1.15, or 1.15% ROC. This is 7.4% below the current price. We are looking at around $2.16 in premium per day, if not more if the premium gets sucked out faster.
CAT currently has a 2.93% divvy yield as well, if I do happen to get assigned shares. Upon being assigned, I would look to immediately sell calls for more basis reduction.


ARBITRAGE SELL DEER BUY PACCAR INCPE RATIO DEER 21, PACCAR 16
PRC. GAP HAS WIDENED UP IN PAST MONTHS. NOW IT SHOULD BE CLOSED...

Elliott Wave Analysis of Caterpillar (CAT)One way to suggest the end to an impulse wave, bulls need to be cautious as the recent gyrations could also be suggesting an ending diagonal


CAT - Caterpillar has a big hill to climb. This long-term chart looks at the relationship between Caterpillar NYSE:CAT and front-month crude oil futures
The week so far has seen a few points shaved off CAT's 30% rally since election day, when it hovered around its 50 week average. The stock has been pounding against 5 year resistance while mostly shrugging off weakness in Crude. But with no clear path ahead for oil prices and an uphill battle for any infrastructure bill through Congress, can CAT bust through the trend line and "grow into its multiple" as so many analysts predict?
NYSE:CAT / NYMEX:CL1!


Long CAT by Selling June 30 Put Spread 98.5/91.5CAT pulled back after gapping up post earning. It started to re-bounce. I would like to long CAT by setting up a Put Spread.
Position:
June 30 Weekly option: -1x98.5 /1x91.5
Premium: $0.96
Max Risk: $604
Breakeven: $97.54
PoP: 73%
Target: 50% of the premium.

excellent trade! CAT has great potential a it is a strong uptrend and has filled the gap.
I buy at current open.

long catBig support line
The stock bounced at it friday.
The candle was a nice little indecision candle and after a down move like that , there is good chance that we will see a reversal.
Also, the stock gap a lot on earning so after a big move like that the stock usually retrace and then continue to move higher and this is what im expecting.


Caterpillar A pause in the Uptrend?Although the company is facing a Class Action Lawsuit for not complying with either U.S. tax law or U.S. financial reporting rules, with the intention of maintaining a higher share price. The stocks looks appealing from a chart point of view as the recent dip to 90.60$ seems corrective, in the newly established up trend that dates back to March 2016. The ultimate target is 98.90$, but we need o clear the 92.30$ level first. A close below 89.50$ will invalidate the scenario.

