DELTA WITH nice opportunity to go long mid termExpecting a new rebalance before a new reacummulation of new longs mid to long term on Delta.
DAL trade ideas


$DAL with a Bearish outlook following its earnings #Stocks The PEAD projected a Bearish outlook for $DAL after a Positive Under reaction following its earnings release placing the stock in drift A with an expected accuracy of 100%.
DAL Falling Expanding WedgePotential continuation with confirmations from the MACD histogram.
Will post updates along with targets if there is a breakout.

Delta Air Lines, Inc mark upDelta Air Lines, Inc., typically referred to as Delta, is one of the major airlines of the United States and a legacy carrier. One of the world's oldest airlines in operation, Delta is headquartered in Atlanta, Georgia.

Stock Analysis: DALBig Picture
Price action has been climbing off the lower low of March 7th; currently in sideways consolidation with a series of large bullish engulfing candles.
Price action has run into our 42.71 resistance area. Price needs to break above the Feb 14th high to make a higher high.
As we breakdown the price action layers we see that the price ran into our supply area after a series of two gaps. I would be expecting some retracement back towards the 41.50 - 41.00 based on the psychology of the candles.
38.68 would be the ideal downside target and that would also close some of the recent gaps; however leaving one open around the 33 area.
Could be setting up for some short positions. Despite the economy opening up and the mass assumption that 'demand' will be of major significance it throws caution to the wind that 'some' may decide to utilize other means of transportation; especially with the continuous rounds of flight delays and cancellations due to staffing shortages, hours of waiting on the phone to speak to someone, inflation continuing to climb, and incomes being tested with everything around them slowly eating into their buying power. This may also cause some families to put off vacations in general to a later time or reduce the duration of travels, etc.
There could be some shorting opportunities on both intraday and swing day outlooks within the ranges above; feel free to annotate your charts
Distance between Price and Moving Averages:
SMA20
11.02%
SMA50
9.91%
SMA200
6.18%

DAL all time high demandDelta CEO Ed Bastian: "Over the last five weeks we’ve experienced the highest level of sales and booking activity at any time in our history...I think it’s going to be a very strong summer travel period for us going forward."
My price target is $47.50.
Looking forward to read your opinion abut it.

Delta Air Lines (NYSE: $DAL) Set For Upwards Rally! ✈️Delta Air Lines, Inc. provides scheduled air transportation for passengers and cargo in the United States and internationally. The company operates through two segments, Airline and Refinery. Its domestic network centered on core hubs in Atlanta, Minneapolis-St. Paul, Detroit, and Salt Lake City, as well as coastal hub positions in Boston, Los Angeles, New York-LaGuardia, New York-JFK, and Seattle; and international network centered on hubs and market presence in Amsterdam, Mexico City, London-Heathrow, Paris-Charles de Gaulle, and Seoul-Incheon. The company sells its tickets through various distribution channels, including delta.com and the Fly Delta app, reservations, online travel agencies, traditional brick and mortar, and other agencies. It also provides aircraft maintenance and engineering support, repair, and overhaul services; and vacation packages to third-party consumers, as well as aircraft charters, and management and programs. The company operates through a fleet of approximately 1,200 aircrafts. Delta Air Lines, Inc. was founded in 1924 and is based in Atlanta, Georgia.

DELTA AIR LINES - POSSIBLE BREAKOUTDelta Air Lines is near the major resistance level ahead of the earnings release. The release of Q1 is expected today before the market opens. Better than expected results will be the catalyst for a retest of the resistance level. If a breakout occurs the next stop for DAL is the $45 level. Unsatisfying results will trigger new sales and the price will continue its move into the downtrend.
Risk Disclosure: Trading Foreign Exchange (Forex) and Contracts of Difference (CFD's) carries a high level of risk. By registering and signing up, any client affirms their understanding of their own personal accountability for all transactions performed within their account and recognizes the risks associated with trading on such markets and on such sites. Furthermore, one understands that the company carries zero influence over transactions, markets, and trading signals, therefore, cannot be held liable nor guarantee any profits or losses.

$DAL - Can it break out?Delta has been in descending channel. The price is close to upper channel trend line. If the price breaks above $41, the pattern breakout is confirmed and the price could reach $50.
However, the price has failed to break above $44 prior 3 times, so it would be prudent to take profit around that area.
There is a risk that trend line rejection can happen and the price could revisit $35.
Target 1 - $ 41
Target 2 - $44
Target 3 - $50
Risk - Failed to break above $40 and retrace to $35.
———————————————————
How to read my charts?
- Matching color trend lines shows the pattern. Sometimes a chart can have multiple patterns. Each pattern will have matching color trend lines.
- The yellow horizontal lines show support and resistance areas.
- Fib lines also show support and resistance areas.
- The dotted white lines show the price projection for breakout or breakdown target.
Disclaimer: Not investment advice.

DAL, We need signal to take positionHello guys
According to the chart you can see the price is moving downward trend and it has need more correction to have good R/r then we have permission to take short position until the target.
You should take signal at first then dont forget use stop loss and observe to your capital management.
Take a look on volume guys dont forget to check it, And dont forget to risk free and manage your position.
Everything is shown on chart, If you have question send us messages
Good Luck
Abtin

DAL PutI really like DAL under 33.23. RSI is extremely overbought and needs to breathe. Either we keep strength going today and don't hit entry or we flood and puts print

Delta Airlines Gap FillLooking at the current state of the market, world events, increasing of oil and precious metals, the overall market looks like it wants to continue a downtrend.
There's a gap set on May 22 and May 26, 2020 that has yet to be filled. The potential bear market can bring Delta towards that gap to fill it, then back up to fill other gaps above.
Let me know what everyone thinks!


DAL - Bullflag breakout
Still need to clear 46, before going all in, but all checks all the boxes for reversal to the long side.
Pullback from 46, would the best way to go long IMO.
Inverse Head and ShouldersPrice has broken the neckline. This pattern is not valid until the neckline is broken. There is always the possibility of a retest of the neckline. Before broken, the neckline was resistance. Now that it is broken it becomes a source of support.
Possible stop below 39.20.
No recommendation

$DAL - Descending channel breakout playDelta airline has been in a descending channel and it is currently heading towards the upper trend line of the channel. If the price breaks above $44, the pattern breakout is confirmed and could travel further up to $54 area.
Target 1 - $44
Target 2 - $54
Risk - Rejected from trend line and revisit $35 area.
Traders should raise the stop loss as the price travels upwards.
If you like charts like this, follow me and subscribe to my posts.
———————————————————
How to read my charts?
- Matching color trend lines shows the pattern. Sometimes a chart can have multiple patterns. Each pattern will have matching color trend lines.
- The yellow horizontal lines show support and resistance areas.
- Fib lines also show support and resistance areas.
- The dotted white lines show the price projection for breakout or breakdown target.
Disclaimer: Not investment advice.

Delta Air Lines SCHEME IMy personal accumulation levels are inside green fib zones. Anything below $35 is a chance for mid-term entry.
Recommended to hold Delta Air Lines shares with a target of $42.8 per share on the horizon of the year, the investment company notes. Delta Air Lines released its quarterly financials.
Despite the relatively good reporting figures, a number of risks remain for the company, which is identified in the previous financial statements.
Concern about rising fuel prices, which may affect the margins of the business.
The spread of "omicron" is another risk.
For the company, we see rising inflation and we are not sure that in the current situation the company will be able to shift the increase in passenger costs through an increase in ticket prices without thereby reducing the level of demand.

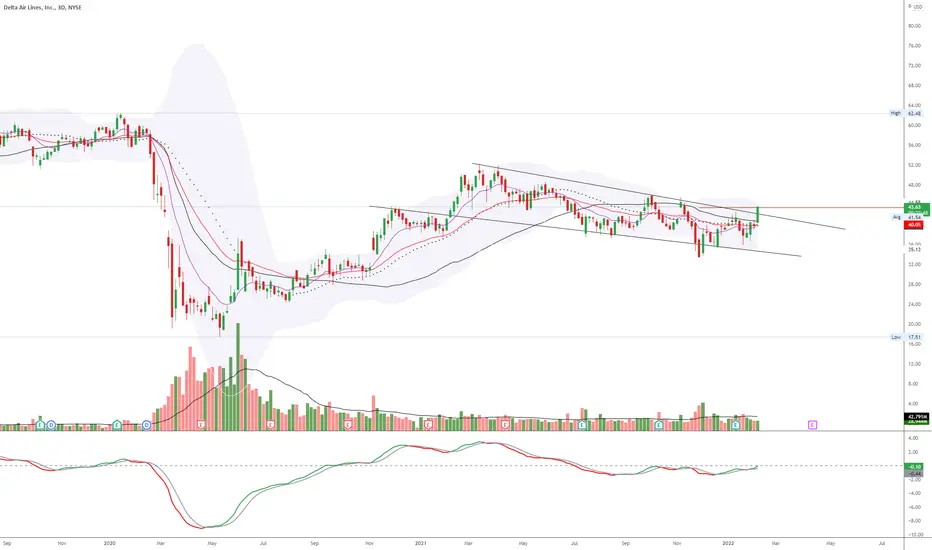
Airlines landing once again?!Pandemic + jet fuel prices + selling pressure will take a toll on the airlines!
In these weekly charts, it is clear that major airlines already are in a Downward channel, and they will retest their previous supports which could be another 10-15% correction in the coming weeks!
You can see the most important support(green line) and resistance (red line) levels.
Best,
Moshkelgosha
DISCLAIMER
I’m not a certified financial planner/advisor, a certified financial analyst, an economist, a CPA, an accountant, or a lawyer. I’m not a finance professional through formal education. The contents on this site are for informational purposes only and do not constitute financial, accounting, or legal advice. I can’t promise that the information shared on my posts is appropriate for you or anyone else. By using this site, you agree to hold me harmless from any ramifications, financial or otherwise, that occur to you as a result of acting on information found on this site.

Delta Wave 3 of final wave 5?I thought share my thoughts on the airline industry. I'll just share my thoughts on Delta Airlines. As many of you may know the sentiment for airline stocks are very bearish due to the pandemic. I believe Delta is about to surprise many. I may be wrong but my analysis of this stock is very bullish. I outline a potential wave 3 move of a much larger wave 5. If you look at what happened in march of 2020 with all the uncertainty surrounding the pandemic, Delta completed wave 4 of 5. Delta is currently in a bullish channel (green line channel) and I believe it just completed an ABC correction of wave 1 of the much larger wave 5. We are currently on the verge of starting wave 3 of the much larger wave 5. I will be adding to longs if price breaks up above the downward channel (red line channel). This is not financial advice, I'm only sharing what I'm doing. Good luck everyone.

looking for a dip to support now ✅dal rejected at local resistance zone, look for a dip to 37.5-38.5 in the near future.
like and follow for more 💘

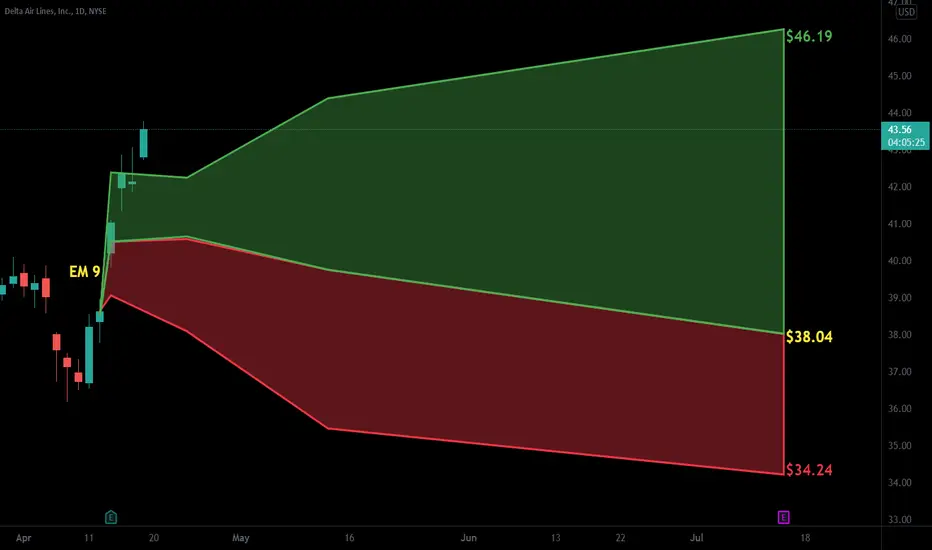
Delta Air Lines earnings are tomorrow at 7:25amDelta Air Lines (DAL) Q4 December 2021 earnings are tomorrow 1/13 at 7:25am. Delta Air Lines (DAL) reported Q3 September 2021 earnings of $0.30 per share on revenue of $9.2 billion. Q3 marked an important milestone in airline recovery, with DAL first quarterly profit since the start of the pandemic. The company said it expects Q4 revenue of approximately $8.29 billion. Tomorrow's guidance will be important as far as fuel prices & Omicron impact. Here's levels on the 1-day chart:
Q4 December 2021 Consensus:
EPS = $0.14
Revenue = $9.14B
52 week high = $52.28
52 week low = $33.40
SMA200 = $42.40
SMA150 = $40.92
SMA100 = $40.35
SMA50 = $39.45
breakout = $46.19
R3 = $44.77
R2 = $43.35
R1 = $41.93
pivot = $40.51
S1 = $39.10
S2 = $37.68
S3 = $36.26
breakdown = $34.84
Do your own due diligence, your risk is 100% your responsibility. This is for educational and entertainment purposes only. You win some or you learn some. Consider being charitable with some of your profit to help humankind. Good luck and happy trading friends...
*3x lucky 7s of trading*
7pt Trading compass:
Price action, entry/exit
Volume average/direction
Trend, patterns, momentum
Newsworthy current events
Revenue
Earnings
Balance sheet
7 Common mistakes:
+5% portfolio trades, capital risk management
Beware of analyst's motives
Emotions & Opinions
FOMO : bad timing, the market is ruthless, be shrewd
Lack of planning & discipline
Forgetting restraint
Obdurate repetitive errors, no adaptation
7 Important tools:
Trading View app!, Brokerage UI
Accurate indicators & settings
Wide screen monitor/s
Trading log (pencil & graph paper)
Big, organized desk
Reading books, playing chess
Sorted watch-list
Checkout my indicators:
Fibonacci VIP - volume
Fibonacci MA7 - price
pi RSI - trend momentum
TTC - trend channel
AlertiT - notification
www.tradingview.com
