$DIA Tomorrow’s Trading Range and everything in it /// 7.14.25Tomorrow’s Trading range and everything in it. How are you playing it?
DIA trade ideas

$DIA Tomorrow’s Trading Range and everything in it /// 7.10.25
Today’s Trading range and everything in it. How are you playing it?
Amazing here how we've stayed right in the iplied move. Green signal line today

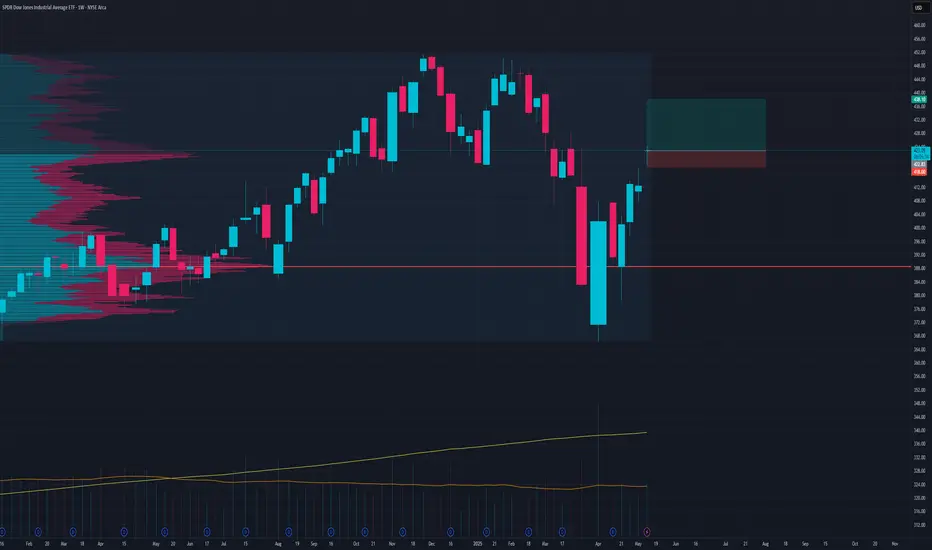
Dow Jones LongsCouple long ideas,
Price action is sitting on big volume note
Sooner or later expect bullish price action
Conservative Position sizing is prudent in this market environment

$DIA // June 17 2025 // CPI Analysis & Targets for Day TradersAMEX:DIA // June 17 2025 // CPI Analysis & Targets for Day Traders

$DIA // June 10 2025 // Analysis & Targets for Day Traders
DIA sticking to that resistance from last Thursday here ahead of Inflation Data!!

SPY and DIA have reached the ML1 LevelsThe SPY and DIA have reached the ML1 Levels.
Always use stops...
Please Use Caution in Fast Moving Markets - Check Charts for Fast Moves
SYMBOL Trend ML 1 MS 1 IDMM Direction Date
SPY Long 595.12 589.56 LONG 2025-06-03
DIA Long 424.85 421.29 LONG 2025-06-03

DIA has reached the MS1 LevelThe DIA has reached the MS1 Level at 420.77
This level being reached is a good indication that the short-term intra-day direction is down.

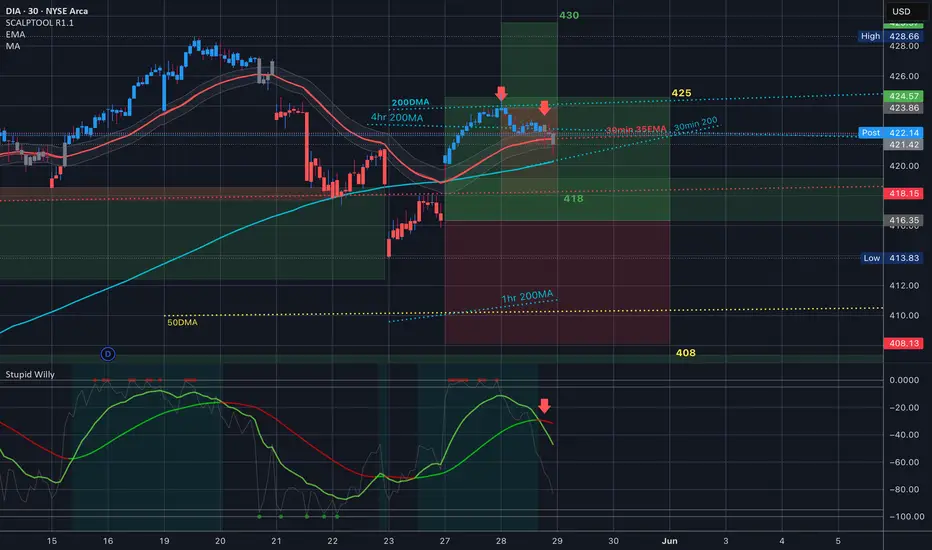
$DIA // May 28 2025 / The Dow rejected at the 200DMA & 4hr 200MAAMEX:DIA The Dow saw some big rejections here today - at the 200DMA and then the 4hr 200MA. The 30min 200 should catch it on the day and then time to look for support. Signal line turned red at 2pm signaling the move lower into close.
$DIA / May 30 2026 CONTRACT / Analysis & Targets for Day Traders
Only the first contract of the week will be public. GL today, y'all...

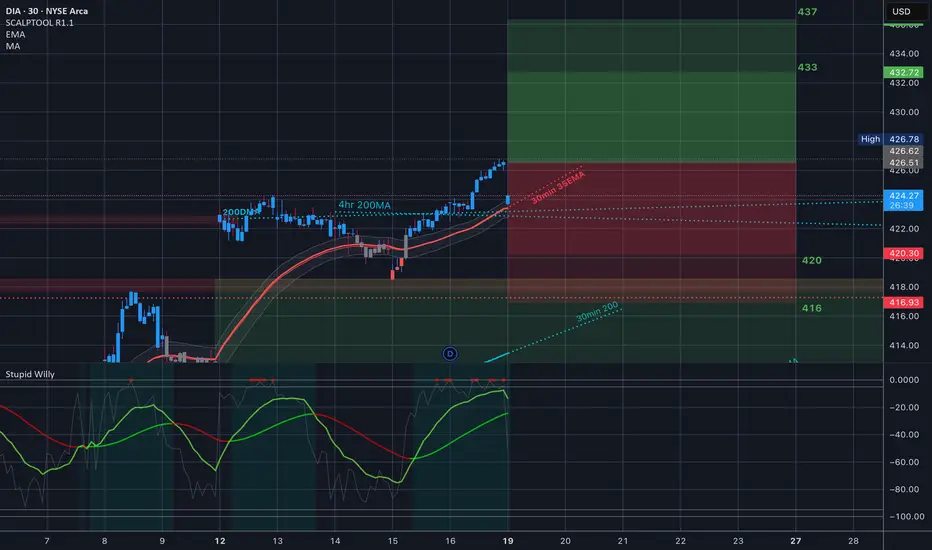
DIA Continuation PumpGap up and push here?
Stop loss could be at 415 but that would not be with good risk to reward ratio
Use proper position sizing and conservatize risk management
SL 418.47
TP 437.31
$DIA // May 19 2026 // Analysis & Targets for Day TradersAMEX:DIA // May 19 2026 // Analysis & Targets for Day Traders
US Downgrade, 3-5-10% Pullbacks But Still Bullish on S&PHappy Sunday!!!
US Futures open lower after Friday's close and Moody's downgrade.
Last time this occurred in 2011, the S&P dropped around 10% from the "news."
This is all interesting timing but I'm still liking pullbacks for opportunities to position
bullish in the US indexes (S&P, Nasdaq, Dow)
Because the melt-up continues to run (US/China gap last week and drift higher), I'm trying to stay patient for a pause or pullback
Trump and Bessent are still chirping about Tariffs and a government "detox" so a round of trade war related news may help calm the market's red hot advance post April 7 lows
I'm selling calls on owned positions for income. I'm waiting for more favorable levels to add new positions, but within 3-4% of all time highs for the S&P and Nasdaq I don't think anybody will be surprised to see the all-time highs revisited in the near to medium-term
Let's have a great week - thanks for watching!!!
-Chris Pulver

$DIA // May 16 2026 // Analysis & Targets for Day TradersAMEX:DIA // May 16 2026 // Analysis & Targets for Day Traders
This is for the May 16th expiration. Have a great weekend guys. 🙌🏼

$DIA Analysis, Key Levels & Targets for Day Traders // May 15 25AMEX:DIA Analysis, Key Levels & Targets for Day Traders // May 15 25
Let's go, we had PPI in premarket w// Powell... Today's range looks fun.

$DIA APRIL 22 2025The DOW closed near the bottom of the implied move yesterday and today we gapped up - so let's go.

$DIA - Recap of Last Week April 14-17
Last week we had a shortened Trading week because of Good Friday.
We opened DIA with a gap up and over the trump tweet gap and we were met with resistance right at the downward facing 30min 200MA
You can see the three arrows all week — you don’t want to go long at a downward facing moving average.
Wednesday UHC and Jerome powell both took a toll on the Dow, and Friday we gapped down and traded near the bottom of the implied move.
I look to the Dow as a leading indicator of market health. When we started in slide down off of ATH’s we saw it in the DOW first. Dow had a rough week here last week. Red 35EMA rejected at the 30min 200MA
Technically a beautiful week. All while closing within the implied move.
ALSO - take a look at where we saw the signal line turn red.

$DIA Trading Range for April 8 2025
35EMA in focus. Just underneath the island gap
Sitting on top of the 200W moving average which is a big level and should offer some support - maybe a slow down and a place to digest tariffs here

$DIA Boom From the Bottom to the Top of the Implied Move
The entire Trading Range is sitting on top of the 200 Week Moving Average.
Alright - Yesterday - We stayed completely with in the implied move - you can see that both sides got tested which gave us some wild swings. Spreads on both ends paid. 10% intraday moves
We hit the bottom of the implied move, the top of the implied move and we saw resistance at the 35EMA.

$DIA Historic Drawdown Week in Review A historic drawdown week with unprecedented tariffs not seen since right before the great depression.
We broke many supports and are looking for Support
Stay Tuned - Today's Trading Range is coming out.
Don't rush into a trader just to trade - But also, if you see a great opportunity take it.

$DIA Interesting close on the Quarterly contract
We had a 0dte contract today because it was the end of the quarter for DIA and we stayed completely within the implied move of that contract.

$DIA Analysis Key Levels & Targets
Added .90 at my 427/429 position - we got smacked down by the 1hr 200MA

$IWM - Trading Levels for March 19 2025
Watching this 200 Day Moving Average today. We got a funny handle looking bounce here on the 35EMA yesterday and the 200DMA has a little bit of momentum left here, maybe enough to hit the weekly 35EMA

$DIA - Trading Levels for March 18 2025 AMEX:DIA - Trading Levels for March 18 2025
Not too much to write today because I’m on Spring Break and even though I am trading I’m not at my computer as much.
We are Neutral bearish here being above the 30min 25EMA but under the 30min 200MA - premarket taking it right to the 35EMA
Super interesting spot here - we closed right at the 200DMA. Just under it and then premarket is starting us off lower.
Grab this chart and let's GO!!!
