DIA Short trade walk through and reviewDIA short trade walk through and review of entry and trade management used. Result was R:R 1.45 on the trade.
DIA trade ideas

DIADIA closed the week at 329.69. Compared to the other major indicies, DIA looks the least bearish this week. DIA held up better than QQQ did as it's components that had ER posted slightly better results on average. DIA did not yet break beneath the previous local low at 328, nor the critical low at 322. It's likely to test both of these levels this week.

DIA over extended down, sellers in control. Risky short target.DIA is in down trend, and sellers are in control, but it looks over extended to me now. There is a risky short entry presented in the video.

DIA multi timeframe analysis. Short bias still in place.DIA is in a down trend, and that is the path of least resistance (as Brian Shannon likes to say). It's been on a fierce downtrend for the last few days, and looks likely to go sideways and/or test resistance before continuing down.

DIADIA closed at 338.27. DIA put in a double top after weak price action moving into the 351 area. DIA broke beneath support at 339, and can move to test lower quickly now. DIA had the most exaggerated move. Puts can work underneath 333.

Breaking down, Breaking apart (DIA)- breaking-down terminated the uptrend channel
- breaking-apart revived the heal-and-shoulder neckline and penetrated it.
- Lack of support could make these one-two punches fatal for DIA.

Head and Shoulders/Channel DownBearish diversion between price and RSI a while back. DIA has been unable to top the ATH since the divergence completed. Price can take a while to correct a divergence between price and RSI, but as a rule, the divergence will correct.
Many draw the bullish divergence on the valleys and a bearish divergence on the peaks.
The Pandemic bottom was 182.10. It seems like we have come a long way down from the high but price has not even hit the 38% mark of the long impulse wave up, and whether or not price hits these levels again remains to be seen. Look down, down and then a little further down and you will see the 38 and the 50% levels marked )o: The .618/62% and .886/89% levels are also marked. I did not realize how far this index had come until I tried to draw the fib levels. It was a stretch to say the least.
There are many possible support levels below and well below price. I got tired of drawing them! Anyway, when one support level is violated, I set an alert for the next level and re-evaluate.
Looks like an ugly top and price has penetrated the neckline slightly today with a bearish, Marubozu candle. At this moment, the top and bottom of the Marubozu is shaven which is very bearish. The neckline is support until it is broken with a confirmed downtrend. Price has broken this neckline before and recovered. Looks like an inverse head and shoulders formed and price came back up.
There is also a descending channel pattern, also known as a “falling channel” or “channel down“. A break out above the upper trendline generates a strong buy signal, while a break down below the lower trendline generates a strong sell signal.
The descending channel pattern is also known as a “falling channel” or “channel down“.
As long as prices remains within the descending channel , the downward trend in price can be expected to continue.
SPY and QQQ appear to be in a channel down. SPY was trading in a megaphone pattern but appears to have settled in to a channel as well. I have not looked at the Russell/IWM in detail as of yet, but just glanced at it and I see a bear flag that is correcting.
No recommendation, except be safe. There will be rallies up a long the way and it can be a good time to sell if you feel the urge. The market is unpredictable and it is a bad idea to try to forecast the future (o: We can only look back, down and all around and make an educated guess.
I am sure the economy is not helping the market right now. But the market has come a long way since the Covid bottom and maybe it is just "that time" )o:


Wondering if DIA/$DJI just got bid up so MM's can push it down?Since RSI dipped down below 33.33 I want to see if it turns down from under 66.66, and if so then puts should work from 348 back down into Monday. Bought 14Apr 146 puts, very small position.

Disclosing my secrets: Growing a small accountYou know, I stan DIA.
But I figured I would share why DIA is such an awesome stock and the stock I used to grow my small account in like a month when I started quant trading (Day trading by technical the only account I could grow was a 50 K account down to 0.20 C. :-/).
I found the easiest way to growing a small account were straddle stocks. DIA is the perfect straddle stock. I have an indicator for DIA that I developed just using my math calculations. At the beginning of the day it gives me a projected high and projected low for the stock.
You may have seen a similar type setup I did with TSLA. But let's look at it with DIA:
Today (April 7th):
April 6th:
April 5th:
April 4th:
April 1st:
And it goes on and on.
Verdict?
When you are growing your small account, really my best advice is to avoid these stocks like TSLA, AMC, GME etc. etc. etc. Meme stocks are generally just betting. You might as well go to a casino. The best way is to chose stable stocks, like DIA (it used to be SPY but no longer would I consider SPY stable LOL) that are predictable and less aggressive.
Get a feel for the market and find little gems like this where you literally can just straddle it and come out ahead each day.
Other stocks similar to DIA that I have used straddles (please note, as of the current market conditions, straddles are hit and miss on most of these stocks):
SPY (debateable)
USO (lately its been erratic but still straddleable)
RTX
There are more but I'd have to charge you ;).
Anyway, just thought I would share some insight.
Let me know your questions/criticisms, etc. below.
Thanks everyone!

Such a Neglected StockWhy is this stock so neglected?
I am a stan for DIA. I like it much better than SPY tbh. Nice options that move that reasonably priced and much more stable.
Lately, this has succumbed to similar volatility as SPY (which is curious because it used to always trade independently of SPY) but DIA is still one of my go to stocks if I want an actual day trade and not a scalp.
But let's hopefully stir some interest in this neglected cousin of SPY and do a bit of an analysis.
So, DIA is looking ... well, identical to SPY on the daily.
Maybe a TAD more bearish looking, but I anticipate it to do what SPY does (and thus, ultimately, its a cheaper alternative to trading SPY if you really think about it. Has better option prices, better greeks, etc. so.... yeah, hint hint ;) ).
But seriously, I actually am far more bullish about DIA than I am about SPY from a technical/mathematical perspective.
Let's look at the monthly chart of DIA since its nascence (below):
And now SPY
DIA has also traded extremely stably but honouring a quadratic type relationship over time. You can see this plotted out statistically in the graph below:
DIA's quadratic relationship to time yields an R value of 0.941 whereas SPY's is 0.840. What does that mean? It means that DIA has been growing at a reasonable and expected pace that is fairly linear and stable.
Thus, using this to plot out DIA's natural price currently, we get a price between 326 and 343, with its current price being 349 based on the following formula:
DIA Qudratic price = (Trading Days * -0.037) + (Trading Days Squared * 1.167E-5) + 118.704
(Currently on day 6094)
= 326
So this is fairly natural growth, IMO.
I think if the market does go into full fledged bear market and we see huge dumps. DIA will follow regardless. But if I had to be bullish about any ETF it would definitely be DIA.
Outlook for Tomorrow
As usual, I will give levels for tomorrow.
DIA's range for tomorrow is 345 - 351.
I am looking for a high around 350 to 351 with a bullish break over 349.08 (DIA operates in a much tighter, more narrow range than SPY).
If it turns out to be bearish, I am looking for a break below 348.79 towards 345.
But I am interested. For anyone actually reading this. Please share your thoughts on DIA! I am genuinely curious to hear what people think of this/whether they trade it/ etc. etc.
Why is this poor thing so neglected? Even YM futures is very neglected with minimal volume.
It is a slow mover, I get it. Its not as fast pace and sexy as SPY. But really, when you're tired and lazy, the slow movement is actually a welcomed relief!
Anyway, please share your thoughts on this!
Thanks everyone and trade safe as always!


diadia
this is the diachart
there is good stuff here
nice prediction from last week
last week still holds true


Rising Wedge on DIA (ETF)After the rising wedge, the price breaks down. This was at the beginning of the pandemic. Therefore, the fundamental analysis is stronger technicals.

DIA 320/315 Put Credit Spread - March 18th ExpiryDIA - The index ETF I like to trade but never gives me liquidity haha.
Fill: 0.544 Fill (after comm)
Strikes: 320 short - 315 Long
Max Loss: 500-54 = 445
Short leg delta': 0.16
Reasoning:
1. White lines identified support/resistance zones
2. 10% return on margin and 16 delta short leg was below these zones and provided additional margin of error
Simple trade with simple management - 50% take profit or -200% stop loss
Questions, Comments, Leave them below!

DIADIA
appanrelty i discovered an easier way to do things
anyways here is double PF tech on
DIA looks good

$DIA H&SHead and shoulders mean reversion.
Price broke support levels (332-338 USD).
Probable FIB retracement to 0.382 (new support could be at around 286-295 USD).
AMEX:DIA


Back down to the ChannelDIA is coming back down after overshooting the channel. This channel is coming from around 2010.
It could be coming all the way down to the bottom of the channel (around 260 -280)


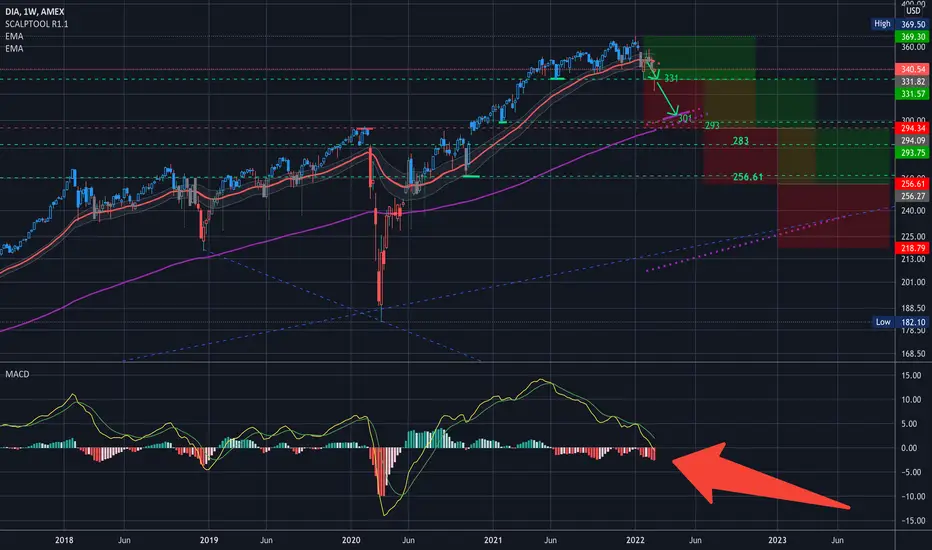
$DIA Analysis, Key Levels and Targets. $DIA Analysis, Key Levels and Targets.
That 331 got hit… and there’s not a whole lot of resistance from here to about 301… to maybe 293 and actually theres a gap at around 283 too to watch … That would be my next place to swing.
That would also be about the top of the pre-pandemic top, which personally I think it needed to correct back then…. So
GL
SPY, QQQ, DIA, & US2000 [3D Candles] - Looking Eerily Similar The major indices as represented by respective ETFs have over the past few weeks become more and more similar in price structure on their daily and weekly charts, among other timeframes. The top left chart is AMEX:SPY , the top-right chart is the NASDAQ:QQQ , the bottom-left chart is the AMEX:DIA , and the bottom-right chart is the FOREXCOM:US2000 (technically a CFD as opposed to an ETF).
For purposes of balancing sufficient detail of the most recent price action against a wide enough view of the larger uptrend context since just after the March 2020 panic low, all four price charts use 3-day candles.
While all four of these tickers -- and therefore their underlying indices -- have experienced a rather pronounced and sustained weakness giving way to a not insignificant period of decline basically since the start of 2022 (with obvious acceleration to the downside more recently, save for the rather modest relief rally experienced several weeks ago), a brief "breather" in the decline for the market to digest the move and chop around for a bit should not be unexpected. That being said, the overall current price structure, sentiment, trend, and momentum -- all from a more traditional technical analysis perspective -- is unmistakable. All four instruments/tickers exhibited well-behaved price action respecting a very clean and orderly up-trend support line since Spring/Summer 2020 -- almost two years obeying a very well-defined clean uptrend support line. That is, until recently. Not only have all four charts broken below the uptrend support line on both daily and weekly candle charts, but price also closed below the broken uptrend line on both a daily and weekly basis. When presumably the retail crowd stepped in at that point to "buy the dip", all four price charts caught a temporary bid rallying back up to near the underside of the broken uptrend line previous-support-now-turned-resistance, thus confirming the trend reversal,
It is recognized that geopolitical tensions and events are almost certainly playing a role in exacerbating the recent market moves over the past few weeks, it should be noted that rarely if ever can various happenings in the financial markets be attributed to one thing or cause. There are almost always, nearly without exception, multiple causalities contributing to a given situation. For example, in the present scenario, there were reliable indications that the GDP in the USA was beginning to slow in rate of change terms as early as later 4Q-2021, while inflation was at multi-decade highs thus exerting political pressure on the Federal Reserve to reverse course and take a hawkish stance as to monetary policy by at eh very least "jawboning" the market into believing that very aggressive rate hikes to the tune of 50 bps up to even 100 bps had a very good likelihood of happening by March 2022, coupled with Quantitative Tightening (i.e., taking back some or a lot of all that crazy large amount of "liquidity"/money he's been injecting into the system over the last two years which has juiced the financial markets to such high levels). But just as flooding financial system and it's cronies juiced the stock market up so far so fast so aggressively cause all that new money had to find someplace to go, it doesn't take a rocket scientist to figure out that happens when the opposite occurs (liquidity/excess-money-reserves are drained from the banking and financial system, even if done in a somewhat cautious, deliberate, and slow manner). And to add "insult to injury", if Jay Powell and the Fed do indeed tighten monetary policy into a decelerating macroeconomic/GDP backdrop, this would be a double whammy. Perhaps even a triple whammy, since we additional aggravating and complicating macroeconomic factors such as the PCE (Personal Consumption Expenditure) which is a specialized measure of inflation that the Fed uses and pays close attention to, and which is by the Fed's own admission alarmingly high and furthermore has a history of remaining stubbornly high once it gets up high in it's particular measure of inflation -- with the Fed admitting that they've had very little if any historical success in bringing that PCE number down once it gets going and feeds upon itself.
So, short story long: you may or may not see a relief rally in the markets over the next few days/weeks (or not), but it would be wise to keep in mind that the present market "turmoil" was set in motion before all the Russia talk the past few weeks. So keep your wits about you and maintain a critical mind.
DISCLAIMER (FOR THE 'G-MEN' GOONS OUT THERE):
The above is presented exclusively for informational, educational, and/or entertainment purposes only. Nothing herein is intended to be, nor should be construed as legal, financial, tax, or any other professional advice of any kind whatsoever. Nor are any statements contained herein intended to be an invitation to form any type of professional advisory relationship including but not limited to attorney-client relationship, financial-advisor-client relationship, tax-advisor-client relationship, or any other professional relationship whatsoever may be regulation or prohibited by law. The above statements are the personal opinions of the author, made with explicit disclaimer of all warranties, whether explicit or implied, as to the accuracy of said statements; and as such the information presented herein should not be relied upon in any capacity. Financial/Capital markets are inherently risky and accordingly carry a significant risk of loss, especially for the inexperienced as well as small retail investor. Before considering any financial decision, especially before considering participating in the capital markets by putting personal capital at-risk, prudence dictates consulting with a qualified professional financial advisor, a qualified tax or other specialist attorney licensed in your jurisdiction. Never risk more money in the financial markets than you are comfortable and 100% willing to lose plus not suffer material hardship to your overall financial wellbeing if you lose it all.
