CUP AND HANDLE PATTERN AS WELL AS AN INVENTED HEAD AND SHOULDER THE BULL MARKET HAS TWO MORE UP LEGS AS IN 1998 AND 1966 FRACTALS
DIA trade ideas

DIA - Dense projectionsLayers on layers of fib gann and waves, this is the most simple chart I came up with.


And Down She Goes!!Recently I published that bonds were going up, which could indicate a possible crash in Stocks.
Here is the Bond Long trade I posted:
If you are in PUTS for SPY/ DIA, i would recommend hold for longer.
Enjoy the profits.
-Shaggad

Divergence Flashing Reversal Warning in DIA? Divergence in technical analysis is simply a separation between price action and various indicators or oscillators. Divergence however, should never be used as a stand alone tool. FlashPoint Trading Academy uses divergence to assist in our swing trade entries and exits.
FlashPoint entered a long in DIA back on January 17th at $141.23. Having noticed a divergence between DIA's price and RSI, Stoch and MACD, we've set a stop-on-close order right below the 10 day EMA to ensure we lock in current gains. Simultaneously, we will also execute a sell stop order to enter a new short position as well with our initial target set at $256.61. Further weakness in the underpinning of major markets could see an even larger move down to $247.58.
If you like our analysis, please be sure to follow us and hit the like button. We greatly appreciate your support here at FlashPoint Trading Academy!


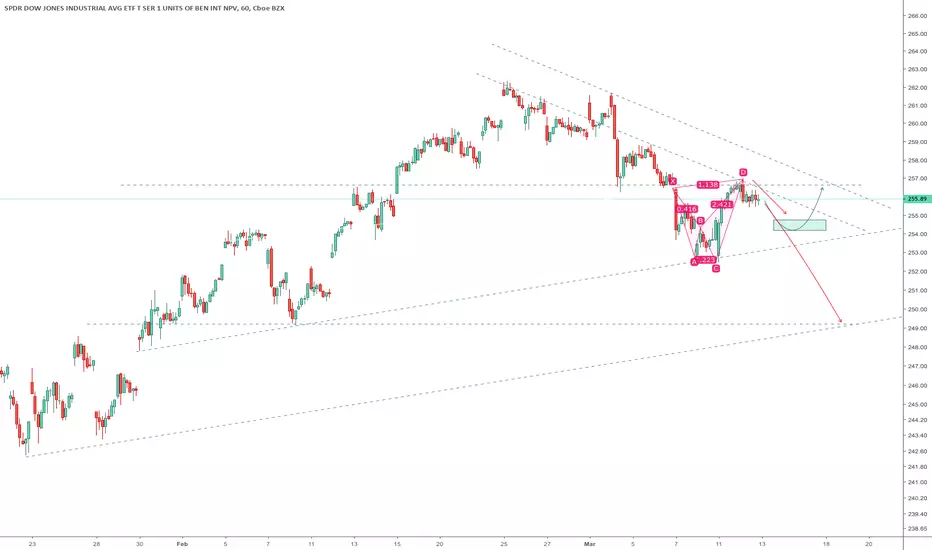
A "1.13" Setup ?Just thought I would provide this as something to think about.
Perhaps this is something you may not have considered.
Should the "abc" within the "Y" leg in fact turn out to
be 5 waves (rather than 3 as shown here), we would then
have a large expanding flat beginning at the Jan '18 peak.
Should this occur, then depending on where the 5th wave of "c"
came in, this setup may/may not then fall within the 1.13-1.618 range.

hello trader, I give you my first EUR / USD analysis.#venezuela
hello trader, I give you my first EUR / USD analysis. I listen to opinions, suggestions. with a lot of humility to learn.
I think you will see a strong break down bear down, since Monday I am trading short with good results

Dow PennantCoiling... not sure which way this will break (depends on economic data and/or China news) but I got this feeling that it will hit the upper trend line first before it breaks up or down.
In other words, more whipsaw action

Shorting the DOW. SL & TPThe Dow is currently rejecting significant trend lines on the weekly time frame and we are witnessing decreasing volume from a weekly perspective also.
As many of you know who follow me, these trade set ups are what I look for as it allows me to set up a good risk:reward ratio in my trade plan with significant price action changes having to occur to stop my trade out. The good old saying goes, The Trend is Your Friend!
Fundamentally, we know that the future is dark economically, and generally I do not look further then technical analysis when implementing a trade plan. But when we look at the fundamental uncertainty on top of the technical set up, we have to get excited about this particular position. If you are following me, you would have noticed a few weeks ago I published a short position for NASDAQ. Well, NASDAQ has since dropped significantly while the DOW has not further indicating that we are both fundamentally and technically advantaged in this trade set up.
I have published the daily chart so that we can view the results of this trade day by day instead of waiting for weekly candles to roll over to update the chart.

DIA IndecisionIndecision in the Market right now.
Bear Case:
*Multiple failed attempt to break resistance
*Head and Shoulder formation
*Broken wedge up
*Lack luster volume
*Bearish divergence on RSI
***Motivation for break lower : recession fears
Bull Case:
* 50 MA broke back above 200 MA
* Price holding above those two MAs
* Symmetrical Triangle engulfing the H&S (Larger pattern usually plays out)
* Possibly a bull flag forming (look at it in the weekly)
***Motivation for break higher : Trade deal
****Personally, I think we break lower... Let's talk about it!

right shoulder to... somewhereBearish shark implies a 0.5-0.618 retrace to the green box... where it'll paint a right shoulder for either a small inv H&S or the larger H&S. The green arrow seems more plausible since the indices just seem to accumulate with abandon on Fridays.
short scalp DJI3hr bear divs at major resistance after monster rally. Long DIA otm puts, currently up 20% holding into next week. Could get shafted by Trump China news, but I have to short this setup

DIA- 2/11/19-2/15/19 expected move atm straddle implies a plus or minus move of $3.80. ive mapped it out based on monday pre-market. support and resistance horizontal lines are based on monthly candles in same range.

ermah gerd someone mentioned trade talksclosed net short trades on BA switched to Long on DIA. trade talks to happen monday and the market looks excited. vix futures still heavily in contango. vix cash below all futures months. based on net change dia options look the juiciest. atm strangle infers plus or minus $3.60. i expect the excitement of trade talks to exceed those levels. i expect to cut positions by monday or tuesday

#DJIA Lacking momentum above MA 200This time will probably not be any different. 5-7 Days above WMA 200. Nothing cast in stone but "History doesn't repeat itself but it often rhymes” - Mark Twain

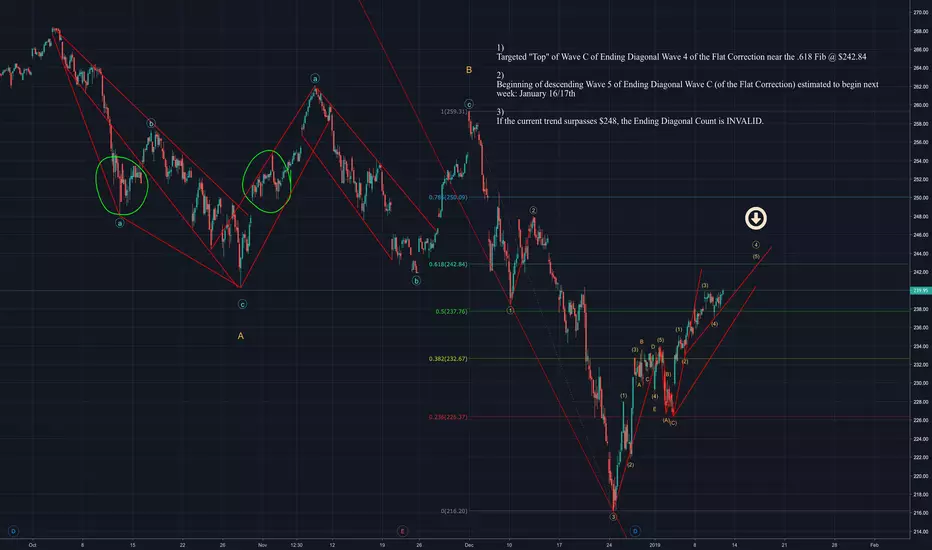
Elliott Count of DIA - Bear Move May Start Next WeekElliott Wave Count: Flat Correction (3-3-5)
- Waves A and B of the Flat have completed.
- Wave C is an Ending Diagonal (*A very small percentage of diagonals appear in the C-wave position* | sequence 3-3-3-3-3)
Current Predictions
1)
Targeted "Top" of Wave C of Ending Diagonal Wave 4 of the Flat Correction near the .618 Fib @ $242.84
2)
Beginning of descending Wave 5 of Ending Diagonal Wave C (of the Flat Correction) estimated to begin next week: January 16/17th
3)
If the current trend surpasses $248 , everything here is wrong/the Ending Diagonal Count is INVALID.
DIA Vertical RecoveryEveryone says the market can't go straight up. Well, it happened last year, so why not again?
Sure looks like there should be a pullback here sooner or later, but the Feds don't meet again until March. We'll be at ATH by that point, lol.

DIA protective stop $247.89After the run the DIA has been on, it is now time to profit the profits with a sell stop at $247.89

Revised Dow Jones projected prediction pathThe chart explains it all. I posted this max level (250) via tweet last week. -ZCMTrading

$DIA Make or BreakMajor test pending for $DIA of upper downward channel.
Each leg down was followed by a .786 FIB retracement- the latest leg being no different.
.50 Channel FIB acted as prior support and is a good first target for shorts.
Just how much we overshot to the downside in DEC, we've likely now overshot to the upside.
Stochastics started to diverge a week ago.
Sitting at BRN (Big Round Number) / Psych Resistance of 25K.
$SPX & $QQQ both hovering at D1 200EMA.
$XLF & $XRT failed to breakout of range.
$XLY & $XLY brokeout with very weak strength.
Have to imagine we see profit-taking either into the weekend or next week.
Feeling like this week is going to end with a sideways-drift, possible lower and folks are going to re-balance beginning in FEB.
