$DIA - Putting a ring on it (Long)223% essentially (my) long-term target price. I'd expect 200% upside @ or around just short of $261 before potential re-trace. Definitely my favorite type of setup.
DIA trade ideas

Market Bullish (For Now) -- Converging Triangle DevelopedAs you can observe in the chart, the Dow Jones price has bounced creating a new support curve. The resistance created by the past three peaks intersects with this support curve on July 6th. Until this day, I believe we can expect bullish behavior within the ascending triangle created by these two curves.
However, there are several other factors that obviously impact the market's flow so you always have to be ready to expect the unexpected.

DJ-30 Breaking down its Triangle formationDJ-30, has gapped down below the current triangular formation and is headed towards the bottom side of the rising channel. This potential setup has a Reward-to-risk ratio of about 2.5


Market BULLISH --- Breakthrough of ResistanceSince the peak of DIA back in early 2018, a very clear resistance curve has been formed with one solid redirection, and two nearby rejections. Things are finally looking good.
With this breakthrough, a new support curve has been developed which appears to remain very strong. However, the curve is extremely aggressive, so we can expect at some point soon a more passive curve to come into play. The curve drawn is a very short term support and you should not consider any downfalls through this curve too seriously.
Due to the breakthrough, this also means that market volatility should be continuing back down to its usual lows as the market is now in a bullish mentality. Leverages such as UVXY and TVIX will most likely continue to spiral downwards bringing great money for shorts.

BEARISH WEDGEIn the chart we appreciate a bearish wedge about the Ind Avg Trust Units Series (DIA) ETF.

DIA is trying to shake off the downward trend.It is important to hold above the line in the next few days. Otherwise this is a bull trap.

Dia opening near downtrend resistanceDow Jones, has been the weakest link so far this year. This morning its morning near or slightly above daily downtrend line. It will be interesting to see how it reacts from there. Interestingly, it is also near or slightly above the 50 day mva.

What's With These Jobs Numbers? - Market Pop on Fake News?Where are these jobs numbers coming from?
On 5/4, the latest U.S. jobs report came out showing unemployment at 3.9%(?!?) with 164,000 jobs added and wage growth virtually nonexistent.
The market (DIA) couldn't decide what to do with that news early on, but Apple (plus tech overall) and energy (stocks like RIG ) were credited with lifting the indices higher, and traders ultimately deciding the jobs report shows inflation being held at bay.
Thank you for lending me your attention!
But if the market pop is on low unemployment (fake news) and staved-off inflation (short-term reprieve from the inevitable), that's not going to prop the market long.
How is that 3.9% unemployment even calculated?
Without going into details, the way unemployment is calculated has changed over the years. Many experts will tell you that if unemployment was calculated as it was back in the 90's, the number would be much, much higher. Even still, I believe unemployment has been miscalculated for a long time - presenting numbers lower than what is realistic - and a claim that unemployment is below is 4% is outrageous.
The jobs environment is desolate, especially for young people. Not only is entry-level pay below livable wages, but a massive amount of jobs are ready for replacement by automation. More and more people are dropping out of the workforce, and record debt levels are coming to pass as the U.S. population is forced to turn to credit - rather than a paycheck - to maintain an acceptable standard of living.
Peak earnings, slow global growth, fake jobs news, a destitute situation for young and old workers alike - the short term (questionable) news can't change the nature of reality, and if there is something that can legitimately send the markets higher, it's not - and won't be -jobs.
Please like, follow, and share, and maybe we can have fun and do great things together.
Thanks again!
See it on the site: holsturr.com/category/markets/charts/
** For speculative and research purposes only - good luck! **

DowJones in Free Fall? - Drops Through SupportAs you can see in the circled area, DIA has dropped below the support dating back to late 2016. This could mean that the price will maintain a free fall back towards the longer term support curve which was almost a full year prior to the new curve. The next few days will be be very important to watch closely as DIA decides its next movement.
The key location to watch is where the resistance curve from the all time high intersects with the older support curve. Two possibilities are prevalent as usual.
1) If the price breaks above the resistance prior to this intersection, we can expect bullish behavior.
2) If the price drops below the support curve prior to the intersection, then mayhem may pursue.

Long the DIA (SPDR DJIA ETF)Reasons:
1. Technical analysis (see the attached chart)
2. earning season
5. stock markets' resistance levels got broken around the world (europe, japan...)
open position: around 248.00
stop loss: if the price falls below the down trend resistance line on daily chart
stop profit: around 260.00

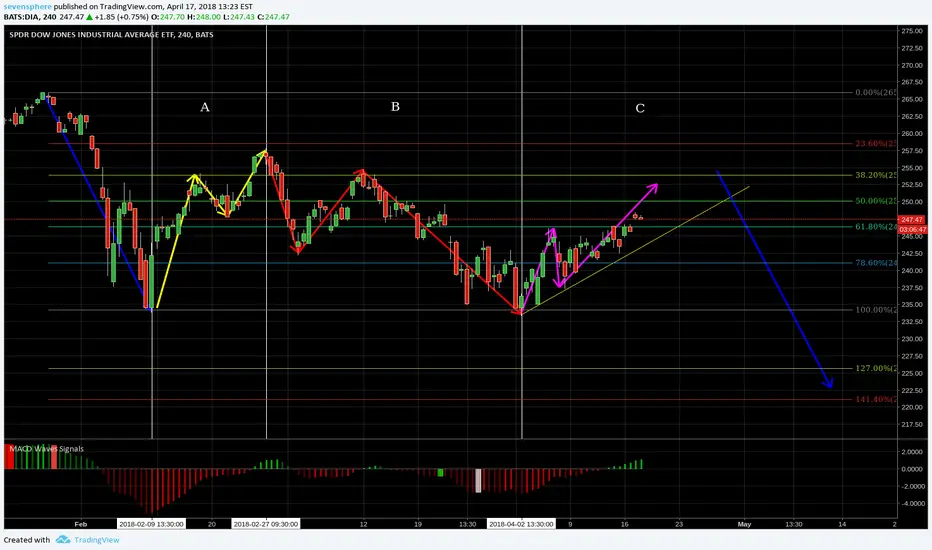
Dont be over bullish on DOWWe are in the C wave of the correction.
If you want to long, you need to wait for the next impulse to complete the 123.
if we get a bearish flag at the end of 3, this trend down will continue.
Trade at your own risk!
DOW Lifting OffHello friends. We have another major index confirming the bullish bias. I'm not excluding a slightly down day on Tuesday, but there seems to be a good bullish pattern forming up here. Thank you for taking a look and please be careful with money :)

Caution - Dow JonesHuge supply volume in this consolidation, with no demand. DIA is weak and another possible dump down to the 200MA and beyond is on the cards

Bull market 9 years old, second longest bull marketAverage bull market lasts 5 year with a 175% return on average. This market has gained 325% since 2009, getting long in the tooth.
Average bear market decline is 32%.
Time to start getting ready imho.
No one has figured out how to time the market, so we draw lots of lines connecting the dots we hope makes us the money.

doing nothing inside and up on the 15er . this is not a regular post. Just a quick post that I could reuse

Market's Support LineAs clearly shown on the chart, the market is not in a downtrend as many may suggest. It has rebounded off of the underlying support line multiple times yet to break through. However, if it does make it through this point, it could very well go into a free fall towards the previous support dating back to 2016.

The Market's Support LinesThe market's current instability is due to talk of "trade war" with China. However, the support line as shown has rejected the fall two times so far. Unless the market breaks through, you can continue expecting an upward trend.

Turtle SoupDIA bounce off 200sma (first test since June 2017) into a Turtle Soup Buy. Higher momentum lows. Powerful short term reversal setup. 234.85 cancels the setup. Trailing stop.


Factors confluence on $DIA - #stocks #indexConfluence of factors bringing indecision in the market; what's the next step?
Looks like everything is consolidating and compressing, taking a pause from the long term bullish trend; in particular, $DIA is sitting on a strong support from which it bounced off on the most recent flash crash of early February and another confluence is given by the approaching 200 days moving average. Lastly, a triangle is taking shape just to remark the consolidation phase the market is in.
What do you think is going to happen next?
