DIA trade ideas

192-200$ the next weekly resistance zone for the DowThe elections result sent DIA back above 182$ and triggered a false break scenario that eventually drove DIA to new record high.
DIA is approaching a weekly resistance zone that starts with the completion zone of a bearish Butterfly pattern.
The other resisting elements are the two trend lines shown at the chart.
192-200 is a weekly resistance zone and with a stop loss above 200$ you can still get about 1:1 R/R as you can see.
Read more and get more trading ideas in this week's newsletters (link in signature)


DOW JONES a keen lookI just came across this. A probable retest can happen. Watch the break of trend-line for validity.

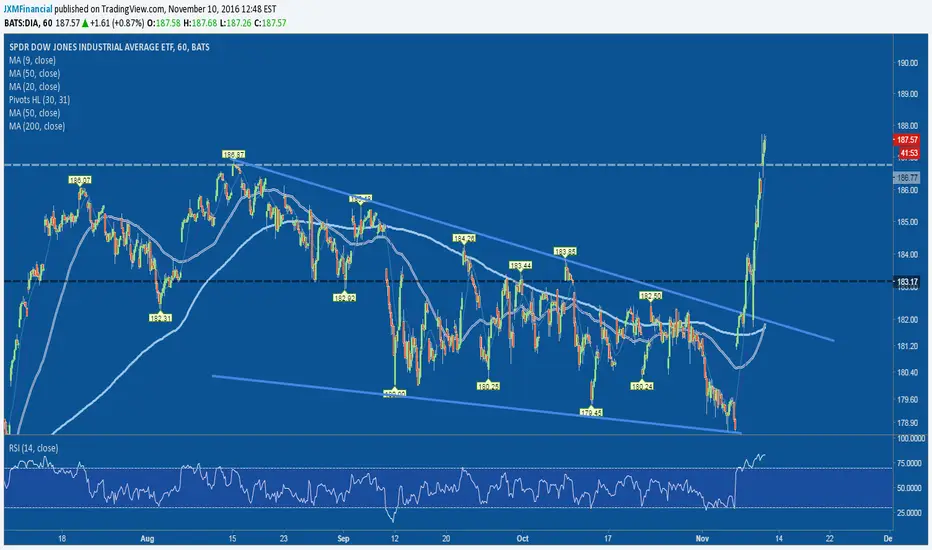
Straight up with strong relative strengthto other indexes today. Watch how 186.87 holds on any pullback
Why are investors so scared of the stock market?I keep a unique price calculation which shows me what the mood of any market is and it is flashing now that we have 85% of the decline needed to create a major bottom in the stock market. But what is fascinating is that normally a drop of this indicator by the amount that it has dropped would normally happen if the market dropped 9%-15% and yet it has only dropped 3% from its peak reading. What does that mean? It means the price action in the market is making people scared. The market drops violently off of the highs which makes investors watching the market fear that it is the "top". Traders, advisors, watchers, commentators get the same feeling too from watching the market each day. The news is negative: Falling earnings, a weak economy, the Fed can't get the economy going, the darn election, the terrible candidates, the bankruptcies, the world tensions, the rising price of oil, the huge budget deficits.... and so on.
Major market bottoms happen when the indicator "RgMov" drops 20 points in the $DIA and the drop into September 2015 was -29.4 points (followed by a bounce of 19%) and the drop into February 2016 was 21.9 points (followed by a bounce of 19%).
I am not forecasting what the catalyst will be to a rally in prices here, but the obvious candidates are "earnings" and "election results".
Check out my other market forecasts in the SPX500, SPY, and DIA and see what comments you have. I do my best to provide unique insights that stem from extremes in sentiment as measured by the VIX index and a pattern that I have found that is reliable in that indicator, and from looking at the whole universe of supply and demand factors. I have also studied what happens when a new Fed Chairman steps in. Oddly enough, the market follows a similar pattern each time. I also consider margin debt since that has correlated to the market average price quite closely. I also look at EARNINGS RELEASES and find that the market clusters around those prices since that is the level where news hit the tape.
Time will tell.
Wishing you all well and success in trading-investing.
Tim
11:54AM EST 10/19/2016

Dow in a clear triangle for final move of correctionDow moving sideways in a larger corrective pattern.
The current clear Triangle should resolve downward. Next motive wave is anticipated to be final in sequence and end the larger corrective structure labeled WXY.
This same pattern is showing in a few large cap equities - which also make up the Dow.
RSI holding in Bearish oscillation zone below 65.
Primary Fib target in relation to channel geometry is at 178 - lower Green horizontal.
Anticipate bullish reversal at the target.
Once closes below ascending trendline are present, orient shorter term trades short until 179.


DIA: How long can this go on?Notice the negative divergence in DIA. However, the similar is not evident on SPY or QQQ.


DOW JONES NEW HIGH POSIBLE AROUND $187Looking at the DOWJONES 3 hour Chart there is Green support line support coming out from July low. Also it broke the red resistance line. So ATH is a possible. Also when I connect High from April/May to the July high and draw the parallel line then the Green line and the red line crosses somewhere around$188 zone and creates a TRIANGLE. If you know how to play narrow triangles then you are a winner. Usually I leave playing triangle because choppy and side trades. But a good options strategies will make some good money for sure.

MA line will be tested on Monday open $DIA closed last Friday just above the Fast MA line that remained support.
The market will react to Friday's Stress Tests on Monday open and this line (the MA line) will be tested as support again.
A close below the MA line can send $DIA back towards the top of the Bull Flag near 180$
If the price will stay above the MA line it can continue north towards the completion of the bearish Butterfly pattern and the trend lines resistance zone near 190$.
This trading scenario is part of this week's FREE newsletters - The Weekly Markets Analysis - goo.gl
Read more and see what other trading scenarios I'm watching towards the coming trading week
Tomer, The MarketZone
www.themarketzone.net
Follow my blog - marketzone.tumblr.com
Subscribe to my Youtube channel - www.youtube.com

DOW JONES UPDATE 4 FUNNEW HIGHS ARE STILL STRONG POSSIBILITY TILL BEFORE OR AFTER ELECTION. CHARTS WILL BE UPDATED THEN.


Dow $DIA Inverse Head and ShouldersInverse head and shoulders pattern with successful test of neckline suggests higher prices ahead.


short on move in cloud money flow weak stoc crossedgeorgebelow 50/ add starting trend/transportation weak/cci and percent r in bottom range/relative strength weak/may starts weak period/macd crossed/george soros has large put bets on market


