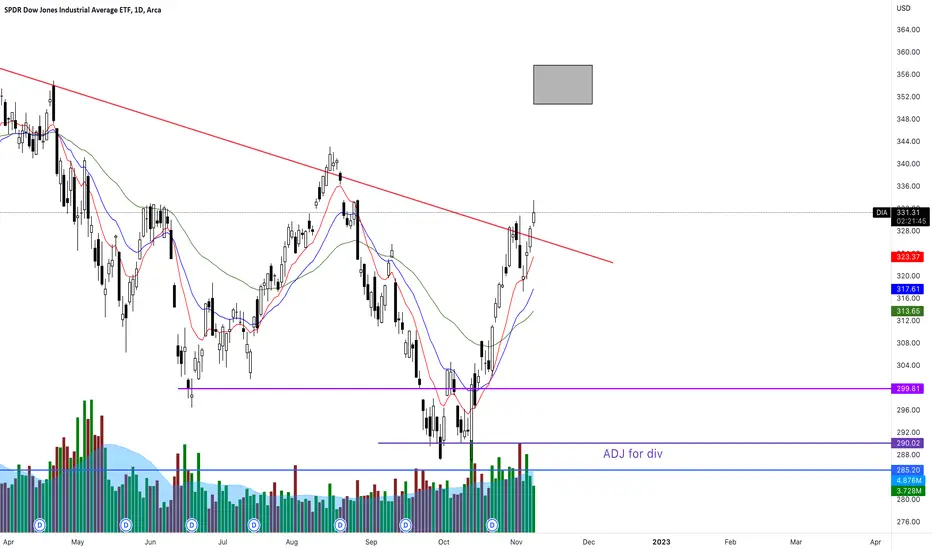
Symmetrical TriangleSomeone who is super bullish may call this a Bull Pennant. For now, I will call it a triangle and if this breaks up I will re-eval. Either way it is neutral until broken.
Price is well above the .382 in spite of the long and tortuous down turn in the market. This has been soooooo slowwwww!
No recommendation/Possible M forming.
ST= symmetrical triangle.
DIA trade ideas

SUPPORTS BANDS DIAPrice action moves on waves.
Fibonacci is a powerful tool where we clear can see a highly possible resting zone for a bigger move.
Long or short could be depend over you strategy.
For me testing the Golden Zone indicates a bigger move over the near future.
I consider them healthy market resting retracements towards a golden zone.
Like I always say... Only time will tell.

LEAPS expire FridayExpect volatility because LEAPS expire on Friday. US stocks 2023 LEAPS (Long Term Equity Anticipation Securities) expire on this Friday, January 20th. 2024 LEAPS expiry date is on January 19th, 2024. 2025 LEAPS expiry date is on January 17th, 2025. Here's a 1 day DIA, IWM, SPY, VTI & QQQ comparison chart with the tickerTracker MFI oscillator set to 20. Also, I compiled LEAPS options data below.
DIA 1/20/2023 expiry options data:
Put Volume Total 33,982
Call Volume Total 16,743
Put/Call Volume Ratio 2.03
Put Open Interest Total 175,346
Call Open Interest Total 120,549
Put/Call Open Interest Ratio 1.45
DIA 1/19/2024 expiry options data:
Put Volume Total 126
Call Volume Total 305
Put/Call Volume Ratio 0.41
Put Open Interest Total 25,093
Call Open Interest Total 20,310
Put/Call Open Interest Ratio 1.24
DIA 1/17/2025 expiry options data:
Put Volume Total 21
Call Volume Total 29
Put/Call Volume Ratio 0.72
Put Open Interest Total 5,450
Call Open Interest Total 1,207
Put/Call Open Interest Ratio 4.52
IWM 1/20/2023 expiry options data:
Put Volume Total 251,778
Call Volume Total 75,801
Put/Call Volume Ratio 3.32
Put Open Interest Total 1,286,490
Call Open Interest Total 687,363
Put/Call Open Interest Ratio 1.87
IWM 1/19/2024 expiry options data:
Put Volume Total 636
Call Volume Total 1,357
Put/Call Volume Ratio 0.47
Put Open Interest Total 223,077
Call Open Interest Total 43,642
Put/Call Open Interest Ratio 5.11
IWM 1/17/2025 expiry options data:
Put Volume Total 119
Call Volume Total 472
Put/Call Volume Ratio 0.25
Put Open Interest Total 12,182
Call Open Interest Total 3,009
Put/Call Open Interest Ratio 4.05
SPY 1/20/2023 expiry options data:
Put Volume Total 1,157,609
Call Volume Total 648,690
Put/Call Volume Ratio 1.78
Put Open Interest Total 3,376,937
Call Open Interest Total 1,927,258
Put/Call Open Interest Ratio 1.75
SPY 1/19/2024 expiry options data:
Put Volume Total 11,341
Call Volume Total 6,538
Put/Call Volume Ratio 1.73
Put Open Interest Total 170,475
Call Open Interest Total 166,385
Put/Call Open Interest Ratio 1.02
SPY 1/17/2025 expiry options data:
Put Volume Total 143
Call Volume Total 508
Put/Call Volume Ratio 0.28
Put Open Interest Total 15,733
Call Open Interest Total 10,749
Put/Call Open Interest Ratio 1.46
VTI 1/20/2023 expiry options data:
Put Volume Total 295
Call Volume Total 711
Put/Call Volume Ratio 0.41
Put Open Interest Total 10,113
Call Open Interest Total 28,924
Put/Call Open Interest Ratio 0.35
VTI 1/19/2024 expiry options data:
Put Volume Total 88
Call Volume Total 57
Put/Call Volume Ratio 1.54
Put Open Interest Total 2,676
Call Open Interest Total 6,714
Put/Call Open Interest Ratio 0.40
VTI 1/17/2025 expiry options data:
Put Volume Total 1
Call Volume Total 8
Put/Call Volume Ratio 0.13
Put Open Interest Total 416
Call Open Interest Total 1,462
Put/Call Open Interest Ratio 0.28
QQQ 1/20/2023 expiry options data:
Put Volume Total 477,446
Call Volume Total 257,774
Put/Call Volume Ratio 1.85
Put Open Interest Total 1,236,295
Call Open Interest Total 1,449,555
Put/Call Open Interest Ratio 0.85
QQQ 1/19/2024 expiry options data:
Put Volume Total 15,805
Call Volume Total 1,692
Put/Call Volume Ratio 9.34
Put Open Interest Total 260,190
Call Open Interest Total 193,008
Put/Call Open Interest Ratio 1.35
QQQ 1/17/2025 expiry options data:
Put Volume Total 734
Call Volume Total 499
Put/Call Volume Ratio 1.47
Put Open Interest Total 54,776
Call Open Interest Total 24,990
Put/Call Open Interest Ratio 2.19

Crowded Dow giving back some and sp500 at 200 day MA sellersRare to see the dow index be the leader on the downside.
Sp500 at 200 day moving average , again.
Vix relatively low for the range in last year.
percentage of stock above 200 and 50 day moving averages also both at top of the relative range for year.
price discovery at work!


PennantThe pole is Down.
The top line is resistance (R) and the bottom line is support (S).
Neutral until broken.
2 spinning tops in a row on the weekly timeframe representing extreme indecision.
No recommendation

$DIA liquidity grab into 2023Broke above daily pivot point $328.65 after $DIA grabbing liquidity and pushing it back up to yesterday's local resistance near $331.5 into pre-market. The next order block has lots of sellers going into 2023.
NEWS:
The economy is hurting from the collapsing retail, freight delays and now the national rail strikes happening this December. Markets seem to be bearish for the medium term, in addition to the market's worse year since 2008 as S&P fell 19.4% in 2022.

Continued Sell Off…??High inflation, terrible earning, world climate and trend analysis are panning out for a sell off.

DIA: First week of Jan! 🎉🎉DIA is on my play list this week.
The market had a fairly bullish end on Friday. However, probability is favouring a move to the downside on the swing levels (the indicator you see displayed in the chart).
That is not to say we won't see upside first, but the probabilities are pretty bearish I have to say. And like its across the board here. Dare I say its pretty convincing.
Here is what to know going into this week:
Immediate target is 332.07, its a pretty easy give-away target.
If we open below it, its going to likely be a long to this level. If we open above it, its likely going to be a short to this level.
The other level that needs to be resolved by Wednesday is that purple line.
That price is at 331.38.
I am hoping both of these targets are taken out on Tuesday to make them a none-issue. But what you need to know is opening above both of these levels is persuasive for a very swift short.
Opening below these levels is the inverse, I would prepare for a long pretty soon.
Opening on them would be pretty anti-climactic.
We will get our swing targets on open on Tuesday which I will post as an addendum. However, the immediate targets to watch are shaded in those boxes.
If this is going to be bullish, we should end up within that green box.
IF its going to be bearish, we should see that green-box bypassed and make a move down to the red box.
Hitting both boxes is possible, it just doesn't happen as frequently. I think we should see pretty decisive movement pretty quickly.
Those are my thoughts for right now. I will update as the the chart becomes more decisive and clear.
As I write this, futures has opened and we have some bearish weekly targets (99% targets) coming in.
Very exciting!
Safe trades everyone!

Educational Options Video Strangle v Capped Strangle Jade LizardConceptual view of how to trade non directional or semi directionally using strangles and capped strangles, also known as Jade Lizard option spreads.
Non directional option trades attempt to benefit from sideways markets or markets where options are are pricing more implied movement than is realized in the underlying asset.
Combing a vertical on top with a cash secured put on bottom, creates a range trade. Selling on both sides for credits helps either reduce the cost of buying shares or creates income while the stock trades sideways without direction.
DIA SPX QQQ VIX NYSE:PLTR SNAP

DIA bear call spreadDecember week 1 350 / 355 bear call spread for .65 limit credit.
IF we trade sideways OR roll over, this will be a nice location
DIA closes above SMA200DIA closed at $328.58 today. That's above it's SMA200, $326.49, on the 1 day chart. Bull trap or breakout from the bear market?
DIA 1 day chart levels:
SMA50 = 309.53
SMA100 = 313.85
SMA150 = 320.69
SMA200 = 326.49
SMA20 trend channel
top = 328.42
R3 = 322.34
R2 = 316.26
R1 = 310.18
pivot = 304.10
S1 = 298.01
S2 = 291.93
S3 = 285.85
bottom = 279.77
Do your own due diligence, your risk is 100% your responsibility. This is for educational and entertainment purposes only. You win some or you learn some. Consider being charitable with some of your profit to help humankind. Good luck and happy trading friends...
*3x lucky 7s of trading*
7pt Trading compass:
Price action, entry/exit
Volume average/direction
Trend, patterns, momentum
Newsworthy current events
Revenue
Earnings
Balance sheet
7 Common mistakes:
+5% portfolio trades, capital risk management
Beware of analyst's motives
Emotions & Opinions
FOMO : bad timing, the market is ruthless, be shrewd
Lack of planning & discipline
Forgetting restraint
Obdurate repetitive errors, no adaptation
7 Important tools:
Trading View app!, Brokerage UI
Accurate indicators & settings
Wide screen monitor/s
Trading log (pencil & graph paper)
Big, organized desk
Reading books, playing chess
Sorted watch-list
Checkout my indicators:
Fibonacci VIP - volume
Fibonacci MA7 - price
pi RSI - trend momentum
TTC - trend channel
AlertiT - notification
tickerTracker - MFI Oscillator
www.tradingview.com

DIA trading within CPI Range from June!Dow Jones is still trading withing the range of the past few days which also places it within the range it was in back when we had a major decline following a disappointing CPI report back in the beginning of June. This puts the market in a position that could see a potential breakout in either direction. Can we possibly see economic data that propels the Dow higher out of the top of the range or will the trend of negative data to end the year continue forcing the market out of the lower end.
Manufacturing data released today suggest that the economy is continuing to slow, and we have recently seen forward earnings projections for giants such as Tesla ($TSLA) and Apple ($AAPL) be reduced. This is consistent with a muted rally we are seeing here for the Dow to start off the week and a 1% down day for the Nasdaq. I stand by my previous statement here to start off the week. I would be looking for short positions, with potential long positions to hedge going into 2023. However, we still are trading within this range and have no indication yet as to which way the wind will blow for the Dow Jones Industrial Average. There are some other signs that point to the potential outcome such as a weakening semiconductor industry ($SMH) and transportation index ($DJT) still trading below its 8 day average.

Vertical Option Spreads for a bear market- a handy tool to haveEducational purposes only: if the bear market continues, one tool Im keeping available is bear vertical spreads. I dont want to go straight short the market, and buying high valuation is a no for me. So bear call spread might be worth a shot while waiting for bullish opportunities.

40 Bar Cycle Chart - Dow Jones DIA DJIA - Updated 121722This last week, markets initially rallied on the release of the "cooler" than expected November CPI (Consumer Price Index) — only to be smacked back to reality on the comments via Federal Reserve Chairman J. Powell during the December Interest Rate Decision (FOMC) meeting this last Wednesday as "higher for longer" is the communicated pathway forward for the FED and financial markets.
Whether this is all talk to put some intentional downward pressure on markets, as financial conditions have eased as of late — or this is the actual pathway forward and the bond markets are mis-pricing the projected Terminal FFR (Fed Funds Rate, now >5% into 23'), some indicators such as our (40-Bar Cycle Chart) 📉 are highlighting what is likely another leg down in financial assets as QT ramps up and higher interest rates take their toll on real economic activity. Keep in mind that behind the scenes, the FED in coordination with the U.S. Treasury are working their magic 🧙🏼♂️🔮 in terms of FED Net Liquidity to keep things "(dis)orderly".
Here is the updated 40-Bar Cycle Chart for DIA DJIA, which seems to be sitting on some major support. Given the structure of the markets after losing the $330 DIA / $33,000 DJIA, along with J. Powell and other FED speaker comments post-FOMC on Friday, is the hopes for a year-end 🎅 🎄 rally wishful thinking?
DIA Daily Chart Template
www.tradingview.com
Which camp are you in on the short-term (end of year into Q1/23') direction of markets?
Camp A: We are likely we headed for new lows in Q1/23 (Fluctuating Inflation + Persistent Price/Wage Pressures + Hawkish FED).
Camp B: We are likely to break the downtrend into the start of Q1/23' (Peak Inflation + Deflationary Forces + Dovish FED).
Let me know your prediction in the comments below! 👇🏼

DIA - Starting RS of Inverse H&S?If AAPL's topping formation (see my AAPL analysis) is any indication, and the Dow's 5300 point move off the October lows is any indication, the right shoulder of the inverse H&S formation should start to get filled as AAPL completes it own right shoulder with a move down. Again, similar to AAPL, the left shoulder, head and right shoulder if formed would line up in time and price. We have what could be a false breakout of the descending trend line on declining volume and RSI within an ascending triangle as a result of the prior two CPI reports. Market needs to correct if any meaningful advance is to occur. Any continued up move is delaying the inevitable. I think that we are close. Happy Trading!

short call spreads working in dow index DIA on mean reversionIts not a good sign when the dow is getting bid up more than the growth sectors. Could be implying investors and institutions DIA who have to buy stocks are preferring blue chip dividend payers because they dont see growth in the near term. QQQ AAPL

40 Bar Cycle Chart - Dow Jones DIA DJIA - Updated 121022Given that we are headed into the release of the November Consumer Price Index this upcoming (Tuesday, December 13th) and also the December Federal Reserve Interest Rate Decision (Wednesday, December 14th) , are markets set up for another short opportunity into the end of January (Q1)?
DIA DJIA Daily Chart Template
www.tradingview.com
Which camp are you in on the short-term (end of year into Q1/23') direction of markets?
Camp A: We are likely we headed for new lows in Q1/23 (Fluctuating Inflation + Persistent Price/Wage Pressures + Hawkish FED).
Camp B: We are likely to break the downtrend into the start of Q1/23' (Peak Inflation + Deflationary Forces + Dovish FED).
Let me know your prediction in the comments below!

selling call option spreads until the stock market gets cheaperstock market is pricing in close to 20 PE currently which is roughly a 5% earnings yield, while bonds are paying close to that. next years expectations are still that we see a rise of as much as 10% higher earnings. If we instead slow down earnings growth, the market may be too expensive. SPX SPY IWF QQQ DIA

DIA Dow Jones Outlook For 2023Throwing a textbook at the charts it becomes clear at what is happening.
This is DIA Dow Jones ETF:
- A Clear double bottom formed that pushed DIA to recent resistance - yellow line
- Another rising wedge is forming which we will see correction, small correction.
- After small correction we will retest Resistance line again.
- AFTER the above we will form a DOUBLE TOP which we can retest resistance.
ALSO note the fibonacci levels at 0.618 we will have to close the gap at the green arrow.

Double Bottom/Over-extended?ATH 369.5.
The double bottom formed a little while back.
Fairly steep climb and has surpassed the 1.272 on it's 4th leg up.
This really looks like it will reverse soon but no telling!
DIA is at a resistance trendline and it remains to be seen if it will be broken.
Possibly bit overextended at this level but time will tell.
No recommendation.

DIA Short/Put Entry Coming perfect Short entry coming. lose VWAP YTD and key Fib. let the rest do its job

Short DIA @ prior months resistance Once an area or “zone” of prior resistance has been identified, those price levels can serve as potential entry or exit points because, as the price reaches a point of previous support or resistance, it will do one of two things: bounce back away from the support or resistance level, or violate the price level and continue its trend until it hits the next support or resistance level.
As most other major market indices are at 200-day SMA support we are taking a short position in DIA at the prior months' resistance zone.
