$EEM: Emerging Could EmergeFollowing the developments in AMEX:IZRL , AMEX:FM and AMEX:EEM we see a similar theme developing. Though this may appear to be a head and shoulders, emerging market stocks could be a smart bet while the Fed figures out what it will do next. We will look for support to be between where it is now and 37.5.
EEM trade ideas

MSCI index viewAfter meaningful correction in global markets, especially ripple effect from US economy markets. MSCI index - Emerging markets are now at attractive valuations.
Technically, look at the monthly chart and the support trendline on it. Also, with the series of significant rate hikes by the US Federal Reserve and all global bankers - It seems the last leg of correction might come shortly.
Try to accumulate quality stocks in near future with 3 years long view, especially from NSE 200 basket

$EEM: Long term bottomThe time seems to have come to consider allocating to Emerging Markets here, I am thinking of entering a position today. India and Mexico are set to benefit from decentralization of supply chains, China is about to get stimulus to consumption from govt, and AI is generally a source of growth and higher efficiency for the world going forward (solves the issue with demographics deteriorating). Oil has fallen enough to create a long term tailwind to earnings going forward and demand destruction from it being too high is out of the way (its effects were felt in a recession that took place, combined with CB actions causing further damage.)
Now the Fed has to reverse course, as a bonus, and China credit growth is accelerating again (after being negative for a good while)
I would secure some gains in healthcare to get an Emerging Markets allocation, I had a big position in the top profitable healthcare names as a defensive bet, but AI changes many long term levers here. I do like the idea of trading healthcare actively though, but Emerging Markets seems like a better proposition now and healthcare names are over extended (like NYSE:LLY , NYSE:TMO , NYSE:WST , etc.)
Many valuations are very attractive in Asia currently, and technical setups are getting traction. It's go time.
Best of luck!
Cheers,
Ivan Labrie.

EEM ShortI am bearish on EEM as there identified 3 start pattern which indicates potential reversal for this underlying. Also, it can not break its 50SMA which also indicates potential bearish price action.
In my opinion EEM is going to test 38s soon

EMERGING MARKETS 7 year bottom is in. Huge upside potential.The MSCI Emerging Index Fund (EEM) is posting a bottom rebound pattern similar to early 2016 and 2009. All all cases the 1W RSI previously broke below the 30.00 oversold level and rebounded strongly. As you see these bottoms take place approximately every 7 years. This indicates that the Emerging Markets are only at the start of a two year mega rally.
-------------------------------------------------------------------------------
** Please LIKE 👍, FOLLOW ✅, SHARE 🙌 and COMMENT ✍ if you enjoy this idea! Also share your ideas and charts in the comments section below! **
-------------------------------------------------------------------------------
💸💸💸💸💸💸
👇 👇 👇 👇 👇 👇

Head and Shoulders on $EEMThe $EEM daily chart is showing a massive Head and Shoulders formation, with the Neckline set at $38. This could be a sign that the price will soon break to the downside, as Head and Shoulders are usually considered bearish reversal patterns. The market will now be watching for a break below $38 in order to confirm the bearish reversal. If the price does break below $38, traders may want to consider shorting the $EEM as the price could continue to decline.

EMERGING MARKET INDEX Chart Fibonacci Analysis 030723 1) Find a FIBO Slingshot
2) Check FIBO 61.80% level
3) Entry Point > 39/61.80%

Emerging Markets ETF is about to take offEEM is ready for a 6.5% gain with a stop at 38$ which means 1.25% risk on a trade.

MSCI EM and DXYDollar and EM markets.
A non Brainer with 1:1 correlation.
The DXY (black line) is inverted to show the coorelation with EM.
Strenthening Dollar means weaker EM and vice versa.
Soince with rate ris eback inti the limelight, the DXY should rally an dEM would be under pressure. The weakness of Chines Equity markets which makes up 31% of MSCI EM would also be a factor.

EEM: Emerging Market MSCI (EM) : SELLEmerging markets equities had to clear many hurdles in 2022 but began to recover in the fourth quarter.
But technically, there are hurdles, The Red sloping line of 2021 is the prime example.
After the steep drop in equity markets overall in 2022, It is believed that emerging markets equities may be one of the most mispriced asset classes, with attractive valuations compared with historical levels.
A 15% drop cannot be ruled out...fundamentals are strong, but technicals will sadly rule.

Nowhere to HideEmerging markets have made some terrific gains in the past month, but I would caution with the path ahead. Take a look at the past year's performance of the Hang Seng, KOSPI, IBOVESPA. I've included a chart of the Tadawul, the Saudi stock index, which is significantly weighted in EEM, the emerging market ETF. These are not healthy charts, and rallies provide opportunities for shorting in my opinion.
EEM's breakout from its downtrend will be tested as it compresses between the 50 & 150 EMA's. As of right now, it needs to close above $39.20 to invalidate a daily Head & Shoulders pattern.

Oh Yeah! Confirmation of Going HigherWe stayed above the 9SMA on the 4hr, We are going higher across all risk assets. Fill up the truck this could be a big move!
PS there will be no pull backs in this market cycle. Its straight to the moon!!!


Emerging Markets StrengthWhat will cause EM's to breakout? Last time it was QE.
Clear resistance and near term inflection point.


Change of trend in Asia MarketEEM - Emerging Markets ETF
FXI - China ETF
VNM - Vietnam ETF
EWS - Singapore ETF
EWY South Korea Etf

Asia is GREAT again !I believe the year 2021 and probably the next few years would be dominated by Asia markets, especially China and Hong Kong.
EEM ETF has just broken out of its long term weekly resistance at 52.04 and is poised to go higher in the coming months and years ahead.
Thus, I would be focusing more on Asia stocks , selective ETFs like this one to gain a wider exposure to markets like Korea, Indonesia , Vietnam,etc.

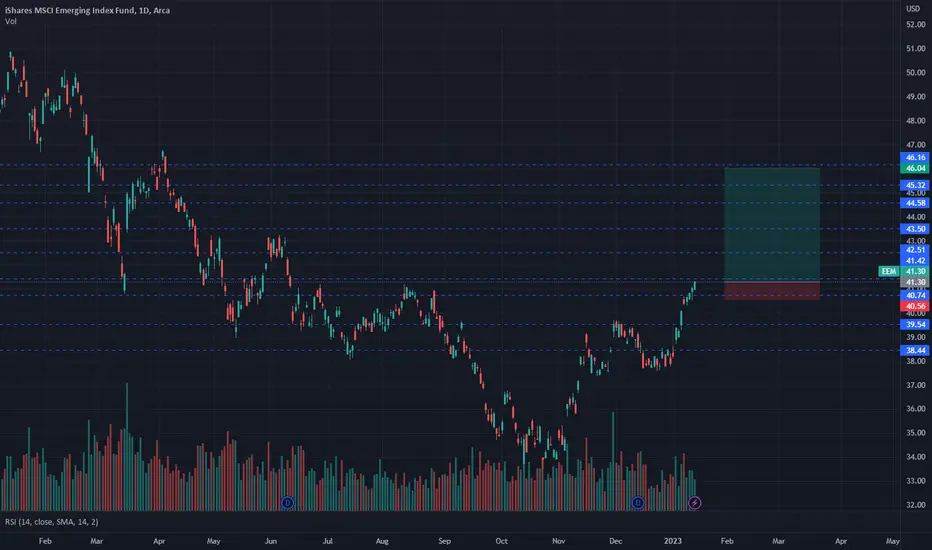
iShares MSCI Emerging Index Fund (Long)iShares MSCI Emerging Index Fund
Long
Entry at 41.30
Take Profit at 46.04 (11.48% profit from entry)
Stop loss at 40.56
EEM: retesting 0.61 and heading lowerEmerging markets is completing a complex correction from an Elliot wave point of view.
The first leg of the C wave started in May21 and is currently retracing before heading lower.
Dollar index broke out and is now retesting the top of its previous range going back till '15.
Secondly EEM and Dollar index are inverse correlated when the market is trending.
VIX lift-off will coincide with this second leg.

Long $EEMMaybe it's time to see emergent markets having a bull run again. Or it will be ruin?
Your call.

Emerging Markets - great place to go short Emerging markets headed up to a technical resistance and provides a good ratio to go short.

MSCI Emerging MarketAfter peaking in Feb 2021 and a slide of nearly 43%, seems like MSCI EM has found a base.

