Key stats
About ISHARES TRUST
Home page
Inception date
Dec 17, 2007
Structure
Open-Ended Fund
Dividend treatment
Distributes
Distribution tax treatment
Ordinary income
Income tax type
Capital Gains
Max ST capital gains rate
39.60%
Max LT capital gains rate
20.00%
Primary advisor
BlackRock Fund Advisors
Distributor
BlackRock Investments LLC
EMB was one of the first emerging-market debt ETFs to be launched, as such, it tends to enjoy strong assets and liquidity. Like many peer funds, but in contrast with our benchmark, EMB holds USD-denominated rather than local-currency debt. This eliminates direct currency risk for US investors, but raises the possibility that a strengthening dollar or weakening local currency could make the debt harder to service, increasing credit risk. Each issuer must have at least $1B outstanding and bonds need at least 2 years remaining to maturity. The fund typically favors longer maturities than our benchmark and tends to lean toward riskier paper, both of which increase yield. One of EMB`s strongest selling points is its strong liquidity, making it the de facto choice for traders.
Classification
What's in the fund
Exposure type
Government
Corporate
Stock breakdown by region
Top 10 holdings

#EMB trade plan up to 15-Sep-23We recommend keeping an eye on this ETF, since the July 25 straddle confirms the range bounds. The straddle was developed with significant financial involvement.

EMB ShortiShares $JPM $USD Emerging Markets #Bond ETF. The fund tracks an index of US-dollar-denominated sovereign debt issued by emerging-market countries with more than $1B outstanding and at least two years remaining in maturity.
Today the EMB 3/17 86P in large size were opened today...
Currency risk

Market Alpha - EMBNASDAQ:EMB
As a way to get exposure to the China housing debacle.... I go over my chart on a new position I opened that has relatively low volatility considering the weight of exposure it may have to the chinese housing collapse.

Trade Idea (IRA/Retirement Account): EMB May 21st 103 Short Put.. for a .95/contract credit.
Notes: With a current yield of 4.032% (4.381/share annualized) versus a TLT (20 Year + Maturity Treasuries) yield of 1.607%, a play to acquire this emerging market bond fund at a 102.05 break even or below. On a one-lot basis, a bit buying power heavy, so consider ac

Emerging Market Bonds To Move Lower?Emerging market bonds denominated in USD look to be taking a leg to the downside.
Could this be an early signal of global liquidity drying up again? 👀
The monetary policy suggests stimulus but fiscal policy is at a stand still. Without more cooperation between politicians and parties this could b

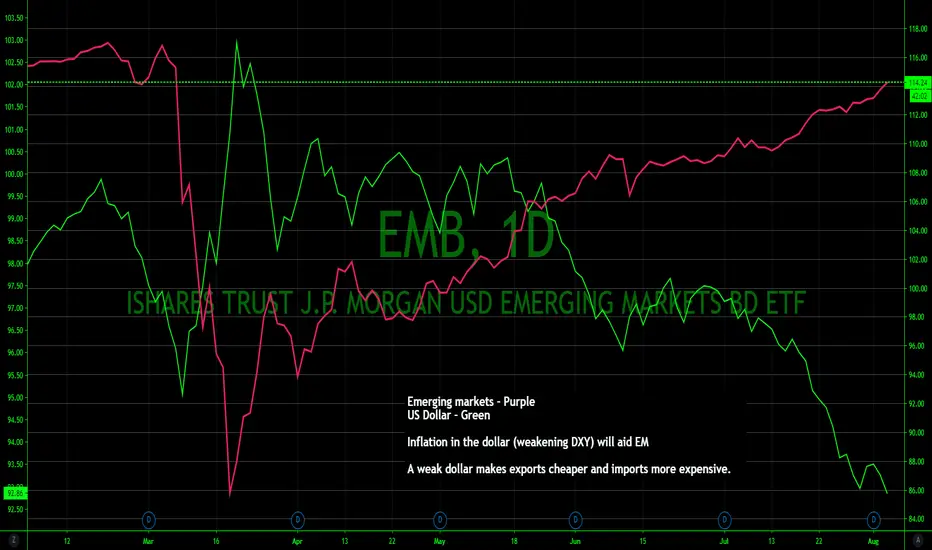
Received a Correlation request on the dollar vs emerging marketsPlease be sure to share and let me know if you have questions or disagree.
TRADE IDEA (IRA): EMB JUNE/JULY 94/92 SHORT PUT LADDERAlthough IV is not ideal here (20.1%), this is another one I've had on my IRA shopping list with its current yield of 4.98% and divvies paid monthly.
I would go only two rungs at the moment, since there are only June and July expiries currently available, with the next available in September, with

Evidence of risk appetite in stocks?Looking at Emerging Market Debt vs. US Treasury Bonds ratio - is this evidence of risk on?

$EMB | Monthly TF | Emerging Markets - Bull Flag Breakouttrend has been identified
now find good risk reward set-ups and use good risk management with stops

See all ideas
Summarizing what the indicators are suggesting.
Oscillators
Neutral
SellBuy
Strong sellStrong buy
Strong sellSellNeutralBuyStrong buy
Oscillators
Neutral
SellBuy
Strong sellStrong buy
Strong sellSellNeutralBuyStrong buy
Summary
Neutral
SellBuy
Strong sellStrong buy
Strong sellSellNeutralBuyStrong buy
Summary
Neutral
SellBuy
Strong sellStrong buy
Strong sellSellNeutralBuyStrong buy
Summary
Neutral
SellBuy
Strong sellStrong buy
Strong sellSellNeutralBuyStrong buy
Moving Averages
Neutral
SellBuy
Strong sellStrong buy
Strong sellSellNeutralBuyStrong buy
Moving Averages
Neutral
SellBuy
Strong sellStrong buy
Strong sellSellNeutralBuyStrong buy
Displays a symbol's price movements over previous years to identify recurring trends.
Related funds
Frequently Asked Questions
An exchange-traded fund (ETF) is a collection of assets (stocks, bonds, commodities, etc.) that track an underlying index and can be bought on an exchange like individual stocks.
EMB trades at 90.24 USD today, its price has risen 0.38% in the past 24 hours. Track more dynamics on EMB price chart.
EMB net asset value is 89.63 today — it's risen 4.27% over the past month. NAV represents the total value of the fund's assets less liabilities and serves as a gauge of the fund's performance.
EMB assets under management is 12.97 B USD. AUM is an important metric as it reflects the fund's size and can serve as a gauge of how successful the fund is in attracting investors, which, in its turn, can influence decision-making.
EMB price has risen by 4.48% over the last month, and its yearly performance shows a 1.22% increase. See more dynamics on EMB price chart.
NAV returns, another gauge of an ETF dynamics, have risen by 4.27% over the last month, showed a 1.54% increase in three-month performance and has increased by 7.52% in a year.
NAV returns, another gauge of an ETF dynamics, have risen by 4.27% over the last month, showed a 1.54% increase in three-month performance and has increased by 7.52% in a year.
Since ETFs work like an individual stock, they can be bought and sold on exchanges (e.g. NASDAQ, NYSE, EURONEXT). As it happens with stocks, you need to select a brokerage to access trading. Explore our list of available brokers to find the one to help execute your strategies. Don't forget to do your research before getting to trading. Explore ETFs metrics in our ETF screener to find a reliable opportunity.
EMB invests in bonds. See more details in our Analysis section.
EMB expense ratio is 0.39%. It's an important metric for helping traders understand the fund's operating costs relative to assets and how expensive it would be to hold the fund.
No, EMB isn't leveraged, meaning it doesn't use borrowings or financial derivatives to magnify the performance of the underlying assets or index it follows.
In some ways, ETFs are safe investments, but in a broader sense, they're not safer than any other asset, so it's crucial to analyze a fund before investing. But if your research gives a vague answer, you can always refer to technical analysis.
Today, EMB technical analysis shows the neutral rating and its 1-week rating is neutral. Since market conditions are prone to changes, it's worth looking a bit further into the future — according to the 1-month rating EMB shows the sell signal. See more of EMB technicals for a more comprehensive analysis.
Today, EMB technical analysis shows the neutral rating and its 1-week rating is neutral. Since market conditions are prone to changes, it's worth looking a bit further into the future — according to the 1-month rating EMB shows the sell signal. See more of EMB technicals for a more comprehensive analysis.
Yes, EMB pays dividends to its holders with the dividend yield of 5.31%.
EMB trades at a premium (0.29%).
Premium/discount to NAV expresses the difference between the ETF’s price and its NAV value. A positive percentage indicates a premium, meaning the ETF trades at a higher price than the calculated NAV. Conversely, a negative percentage indicates a discount, suggesting the ETF trades at a lower price than NAV.
Premium/discount to NAV expresses the difference between the ETF’s price and its NAV value. A positive percentage indicates a premium, meaning the ETF trades at a higher price than the calculated NAV. Conversely, a negative percentage indicates a discount, suggesting the ETF trades at a lower price than NAV.
EMB shares are issued by BlackRock, Inc.
EMB follows the J.P. Morgan EMBI Global Core Index. ETFs usually track some benchmark seeking to replicate its performance and guide asset selection and objectives.
The fund started trading on Dec 17, 2007.
The fund's management style is passive, meaning it's aiming to replicate the performance of the underlying index by holding assets in the same proportions as the index. The goal is to match the index's returns.