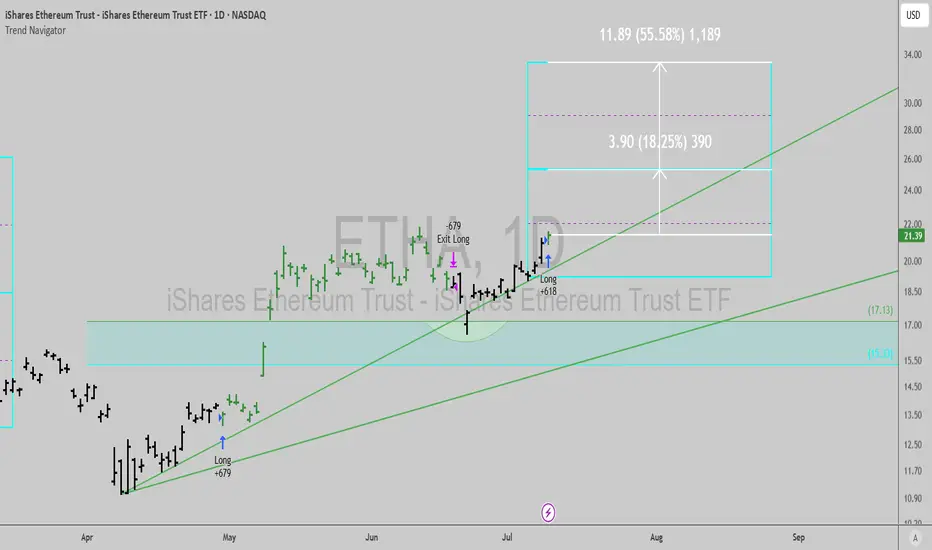
$ETHA: ETH ETF about to explode higher...For now, ETF buyers are down since inception, but that is about to change.
The Trend Navigator algo is flashing a buy signal today, as weekly flashes a Time@Mode signal.
(obligatory to mention that the Trend Navigator algo is up 30% ish in this chart in the same period)
A lot of people are either s
Key stats
About ISHARES ETHEREUM TRUST
Home page
Inception date
Jun 24, 2024
Structure
Grantor Trust
Replication method
Physical
Distribution tax treatment
Ordinary income
Income tax type
Capital Gains
Max ST capital gains rate
39.60%
Max LT capital gains rate
39.60%
Primary advisor
BlackRock Fund Advisors
ETHA aims to track the spot price of Ether, less expenses and liabilities. It intends to provide accessibility to Ether without the complexities of acquiring, holding, and trading directly through a digital asset platform. The trust is backed by Ether held in cold storage, which is a safeguarding method by which the private keys corresponding to the trusts Ether are generated and stored offline, making them more resistant to hacking. Holdings are valued daily based on the CF Benchmarks Index, which serves as a once-a-day benchmark rate of Ether USD price, calculated as of 4:00 pm ET. The index aggregates the trade flow of several Ether platforms during an observation window, focusing on relevant transactions, as defined by the index provider. During its launch, the Issuer waived a portion of the fee. The funds expense ratio and tracking should be reviewed and considered for comparison purposes.
Related funds
Classification
Symbol
Geography
Global
What's in the fund
Exposure type
Cash
Bonds, Cash & Other100.00%
Cash100.00%
Top 10 holdings
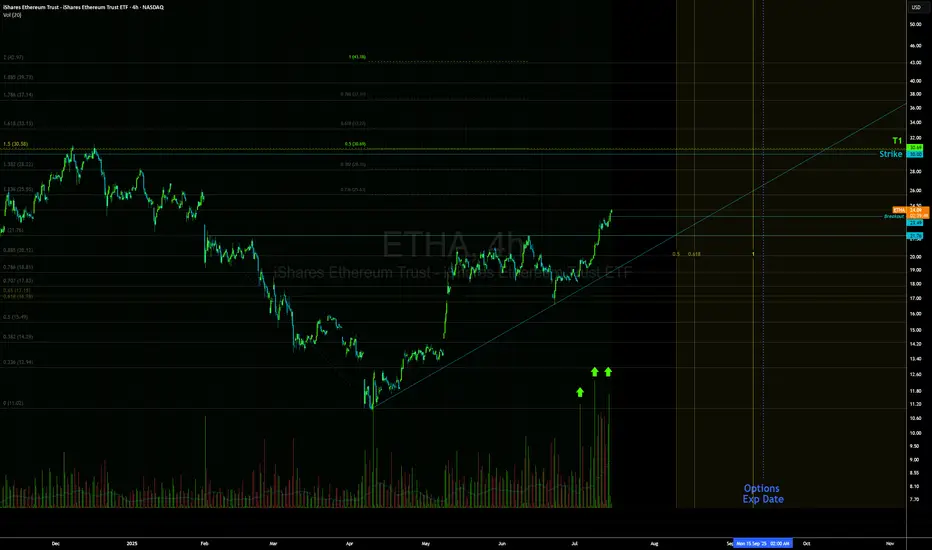
ETHA LongBreakout of inverse H&S, BTC massive breakout and following through.
Looks like we can see $30 +, Buying time on these contracts. Volume looks amazing.

Ethereum Rally (?) : Strong Infusion with Volume RequiredEthereum can make a very strong rally of at least 35-40 percent.
And so the same goes for the Ishares Ethereum Trust ETF. (ETHA ETF)
But it needs to break the pennant.
And we need to observe strong volume.
Also, if we stay above the 50 and 200 period moving averages while this is happening, good

Ethereum $ETHA ETF Daily Chart Fibonacci SupportEthereum NASDAQ:ETHA ETF Daily Chart Fibonacci Support
🚨 **Ethereum CRYPTOCAP:ETH ETF Daily Chart Update** 🚨
📊 **Fibonacci Support at 0.786 Holding Strong!**
Ethereum’s ETF chart is showing resilience at the **0.786 Fib retracement level**, a key support zone. If this level holds, we coul

ETHA | Ethereum RoadmapWhat is the Blue Box?
The Blue Box represents a carefully identified price range where ETHA's price is likely to exhibit significant reactions. These reactions could result in reversals, consolidations, or breakout opportunities. This zone is identified using technical analysis tools such as hist

BlackRock's Ethereum ETF crosses $1B AUMBlackRock's Ethereum ETF has passed SEED_TVCODER77_ETHBTCDATA:1B in AUM.
Meanwhile, Grayscale's ETHE seems to have stabilized.
After months of sustained outflows (led by Grayscale), will ETH momentum finally emerge?

Ethereum ETF Launch Causing Temporary Crypto Dump!Last week was the official launch of the long anticipated Ethereum spot ETF. Sadly, the markets dumped right after trading went life.
We have seen the exact same thing happen earlier this year with the BTC spot ETF launch, where the ETF lost over 26% of its value in the first 7 trading days. The Et

See all ideas
Summarizing what the indicators are suggesting.
Oscillators
Neutral
SellBuy
Strong sellStrong buy
Strong sellSellNeutralBuyStrong buy
Oscillators
Neutral
SellBuy
Strong sellStrong buy
Strong sellSellNeutralBuyStrong buy
Summary
Neutral
SellBuy
Strong sellStrong buy
Strong sellSellNeutralBuyStrong buy
Summary
Neutral
SellBuy
Strong sellStrong buy
Strong sellSellNeutralBuyStrong buy
Summary
Neutral
SellBuy
Strong sellStrong buy
Strong sellSellNeutralBuyStrong buy
Moving Averages
Neutral
SellBuy
Strong sellStrong buy
Strong sellSellNeutralBuyStrong buy
Moving Averages
Neutral
SellBuy
Strong sellStrong buy
Strong sellSellNeutralBuyStrong buy
Displays a symbol's price movements over previous years to identify recurring trends.
Curated watchlists where ETHA is featured.

Ethereum ETFs: DeFi and NFTs tap dance to Wall Street
9 No. of Symbols
See all sparks
Frequently Asked Questions
An exchange-traded fund (ETF) is a collection of assets (stocks, bonds, commodities, etc.) that track an underlying index and can be bought on an exchange like individual stocks.
ETHA trades at 25.50 USD today, its price has risen 10.73% in the past 24 hours. Track more dynamics on ETHA price chart.
ETHA net asset value is 25.42 today — it's risen 32.95% over the past month. NAV represents the total value of the fund's assets less liabilities and serves as a gauge of the fund's performance.
ETHA assets under management is 6.28 B USD. AUM is an important metric as it reflects the fund's size and can serve as a gauge of how successful the fund is in attracting investors, which, in its turn, can influence decision-making.
ETHA price has risen by 26.05% over the last month, and its yearly performance shows a 2.82% increase. See more dynamics on ETHA price chart.
NAV returns, another gauge of an ETF dynamics, have risen by 32.95% over the last month, showed a 114.44% increase in three-month performance and has increased by 0.34% in a year.
NAV returns, another gauge of an ETF dynamics, have risen by 32.95% over the last month, showed a 114.44% increase in three-month performance and has increased by 0.34% in a year.
ETHA fund flows account for 23.62 B USD (1 year). Many traders use this metric to get insight into investors' sentiment and evaluate whether it's time to buy or sell the fund.
Since ETFs work like an individual stock, they can be bought and sold on exchanges (e.g. NASDAQ, NYSE, EURONEXT). As it happens with stocks, you need to select a brokerage to access trading. Explore our list of available brokers to find the one to help execute your strategies. Don't forget to do your research before getting to trading. Explore ETFs metrics in our ETF screener to find a reliable opportunity.
ETHA invests in cash. See more details in our Analysis section.
ETHA expense ratio is 0.25%. It's an important metric for helping traders understand the fund's operating costs relative to assets and how expensive it would be to hold the fund.
No, ETHA isn't leveraged, meaning it doesn't use borrowings or financial derivatives to magnify the performance of the underlying assets or index it follows.
No, ETHA doesn't pay dividends to its holders.
ETHA trades at a premium (0.31%).
Premium/discount to NAV expresses the difference between the ETF’s price and its NAV value. A positive percentage indicates a premium, meaning the ETF trades at a higher price than the calculated NAV. Conversely, a negative percentage indicates a discount, suggesting the ETF trades at a lower price than NAV.
Premium/discount to NAV expresses the difference between the ETF’s price and its NAV value. A positive percentage indicates a premium, meaning the ETF trades at a higher price than the calculated NAV. Conversely, a negative percentage indicates a discount, suggesting the ETF trades at a lower price than NAV.
ETHA shares are issued by BlackRock, Inc.
ETHA follows the CME CF Ether-Dollar Reference Rate - New York Variant - Benchmark Price Return. ETFs usually track some benchmark seeking to replicate its performance and guide asset selection and objectives.
The fund started trading on Jun 24, 2024.
The fund's management style is passive, meaning it's aiming to replicate the performance of the underlying index by holding assets in the same proportions as the index. The goal is to match the index's returns.