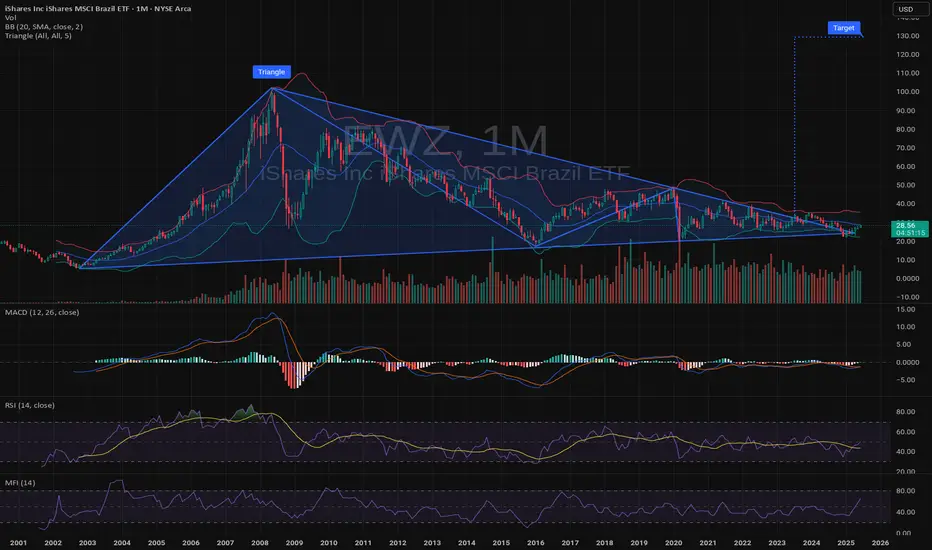
$EWZ LongAMEX:EWZ
I'm long on this. I'm long on international products in general.
I think their time is coming due.
NYSE:NU is a big component of $EWZ. So I get a bit of it as well as other parts.
Of course the charts are just Pictures and may or may not go in the direction as intended.
cheers
Key stats
About ISHARES INC
Home page
Inception date
Jul 10, 2000
Structure
Open-Ended Fund
Replication method
Physical
Dividend treatment
Distributes
Distribution tax treatment
Ordinary income
Income tax type
Capital Gains
Max ST capital gains rate
39.60%
Max LT capital gains rate
20.00%
Primary advisor
BlackRock Fund Advisors
Distributor
BlackRock Investments LLC
EWZ tracks an index of large- and midcap companies from the B3 exchange in Brazil. The index applies limits as imposed on regulated investment companies under the US Internal Revenue Code. No single issuer exceeds 25% and all issuers with a weight above 5% do not go above 50% of the index weight. The index is rebalanced quarterly, starting February.
Related funds
Classification
What's in the fund
Exposure type
Finance
Energy Minerals
Utilities
Non-Energy Minerals
Stock breakdown by region
Top 10 holdings
Update: EWZ December 2026 32 Covered CallHere, starting to break my EWZ position (See Post Below) into its constituent pieces.
The first piece involves shares I acquired way back at 31.65/share. (Ugh). Rather than go back and calculate trade to date break even, I'm going out far in duration to sell the short call at or above my break ev

Opening (IRA): EWZ Oct 17th 26/45 Short Call Vertical... for a 1.13 credit.
Comments: I'm fairly certain that I'm going to be assigned on my January 17th 26 short put, so am going out to October to sell a spread with the short leg at the 26 strike that pays at least 1.00. The reason I do this (sell a call for at least 1.00), is that this enables me

Opening (IRA): EWZ Feb 28th 22.5 Short Put... for a .51 credit.
Comments: After closing my Feb 17th 23 for a small profit, opening up a position at a strike slightly lower than what I just had on, attempting to pick up shares at the lowest price the market will allow. Had to use the weeklies to get into the 22.5.

Opening (IRA): EWZ January 17th 23 Short Put... for a .71 credit.
Comments: Here, I'm just trying to reduce my cost basis in my shares of stock (which is kind of an "ugh" at 31.65), so looking to take assignment at $23/share. Because of this, I will look to run this all the way to expiry, at which point I either get assigned or it expires w

Brazil $EWZ Hanging on by a thread - ShortMacro view of Brazil. Symmetrical wedge with a bias to the downside due to the price being below all macro VWAP + large volume shelf. Short on the macro basis.

BBD - BRADESCO - is doing worse than ITUB and NUHi, if you could add some perspective why bbd is underperforming the rest of the Brazilian Banks?
Thanks

Multi-Year SupportI plan on Adding some long term for EWZ at open today.
Multi-Year support trendline at these levels.
I will either buy shares or 2026 options (This is a buy and do not touch trade)


Potential long on Brazil $EWZ ETFIs it time to become a Brazil bull?
+ AMEX:EWZ iShares ETF down nearly 70% from ATH
+ Pays an indicated 7% dividend
+ Milei's success in Argentina hopefully ignites a free market renaissance across LatAm

See all ideas
Summarizing what the indicators are suggesting.
Oscillators
Neutral
SellBuy
Strong sellStrong buy
Strong sellSellNeutralBuyStrong buy
Oscillators
Neutral
SellBuy
Strong sellStrong buy
Strong sellSellNeutralBuyStrong buy
Summary
Neutral
SellBuy
Strong sellStrong buy
Strong sellSellNeutralBuyStrong buy
Summary
Neutral
SellBuy
Strong sellStrong buy
Strong sellSellNeutralBuyStrong buy
Summary
Neutral
SellBuy
Strong sellStrong buy
Strong sellSellNeutralBuyStrong buy
Moving Averages
Neutral
SellBuy
Strong sellStrong buy
Strong sellSellNeutralBuyStrong buy
Moving Averages
Neutral
SellBuy
Strong sellStrong buy
Strong sellSellNeutralBuyStrong buy
Displays a symbol's price movements over previous years to identify recurring trends.
Frequently Asked Questions
An exchange-traded fund (ETF) is a collection of assets (stocks, bonds, commodities, etc.) that track an underlying index and can be bought on an exchange like individual stocks.
EWZ trades at 27.50 USD today, its price has fallen −0.43% in the past 24 hours. Track more dynamics on EWZ price chart.
EWZ net asset value is 27.45 today — it's fallen 2.74% over the past month. NAV represents the total value of the fund's assets less liabilities and serves as a gauge of the fund's performance.
EWZ assets under management is 5.07 B USD. AUM is an important metric as it reflects the fund's size and can serve as a gauge of how successful the fund is in attracting investors, which, in its turn, can influence decision-making.
EWZ price has risen by 1.44% over the last month, and its yearly performance shows a −4.84% decrease. See more dynamics on EWZ price chart.
NAV returns, another gauge of an ETF dynamics, have fallen by −2.74% over the last month, showed a 12.33% increase in three-month performance and has increased by 0.24% in a year.
NAV returns, another gauge of an ETF dynamics, have fallen by −2.74% over the last month, showed a 12.33% increase in three-month performance and has increased by 0.24% in a year.
EWZ fund flows account for 2.78 B USD (1 year). Many traders use this metric to get insight into investors' sentiment and evaluate whether it's time to buy or sell the fund.
Since ETFs work like an individual stock, they can be bought and sold on exchanges (e.g. NASDAQ, NYSE, EURONEXT). As it happens with stocks, you need to select a brokerage to access trading. Explore our list of available brokers to find the one to help execute your strategies. Don't forget to do your research before getting to trading. Explore ETFs metrics in our ETF screener to find a reliable opportunity.
EWZ invests in stocks. See more details in our Analysis section.
EWZ expense ratio is 0.59%. It's an important metric for helping traders understand the fund's operating costs relative to assets and how expensive it would be to hold the fund.
No, EWZ isn't leveraged, meaning it doesn't use borrowings or financial derivatives to magnify the performance of the underlying assets or index it follows.
In some ways, ETFs are safe investments, but in a broader sense, they're not safer than any other asset, so it's crucial to analyze a fund before investing. But if your research gives a vague answer, you can always refer to technical analysis.
Today, EWZ technical analysis shows the neutral rating and its 1-week rating is neutral. Since market conditions are prone to changes, it's worth looking a bit further into the future — according to the 1-month rating EWZ shows the sell signal. See more of EWZ technicals for a more comprehensive analysis.
Today, EWZ technical analysis shows the neutral rating and its 1-week rating is neutral. Since market conditions are prone to changes, it's worth looking a bit further into the future — according to the 1-month rating EWZ shows the sell signal. See more of EWZ technicals for a more comprehensive analysis.
Yes, EWZ pays dividends to its holders with the dividend yield of 5.88%.
EWZ trades at a premium (0.20%).
Premium/discount to NAV expresses the difference between the ETF’s price and its NAV value. A positive percentage indicates a premium, meaning the ETF trades at a higher price than the calculated NAV. Conversely, a negative percentage indicates a discount, suggesting the ETF trades at a lower price than NAV.
Premium/discount to NAV expresses the difference between the ETF’s price and its NAV value. A positive percentage indicates a premium, meaning the ETF trades at a higher price than the calculated NAV. Conversely, a negative percentage indicates a discount, suggesting the ETF trades at a lower price than NAV.
EWZ shares are issued by BlackRock, Inc.
EWZ follows the MSCI Brazil 25-50. ETFs usually track some benchmark seeking to replicate its performance and guide asset selection and objectives.
The fund started trading on Jul 10, 2000.
The fund's management style is passive, meaning it's aiming to replicate the performance of the underlying index by holding assets in the same proportions as the index. The goal is to match the index's returns.