Riding on the US- China trade talk in GenevaRead this news article here
Go long on these two ETFs. Different in composition , see which one you like better. Hold for longer term.
Key stats
About ISHARES TRUST
Home page
Inception date
Oct 5, 2004
Structure
Open-Ended Fund
Replication method
Physical
Dividend treatment
Distributes
Distribution tax treatment
Qualified dividends
Income tax type
Capital Gains
Max ST capital gains rate
39.60%
Max LT capital gains rate
20.00%
Primary advisor
BlackRock Fund Advisors
Distributor
BlackRock Investments LLC
FXI, one of the oldest China-focused ETFs on the market, is a concentrated portfolio of 50 large cap H-shares, P-chips and Red Chips listed in Hong Kong. Notably, mainland-listed A-shares and US-listed Chinese mega-caps (classified as an N-share) are excluded from the funds portfolio. FXI draws its selection universe from the FTSE All World Index. Stocks are further screened for liquidity to ensure that the market-cap-weighted index is tradable. To avoid overconcentration in the index, stock weights are capped at 9% and company weights at 38%. The index is reconstituted and rebalanced quarterly.
Classification
What's in the fund
Exposure type
Finance
Technology Services
Retail Trade
Stock breakdown by region
Top 10 holdings
No news here
Looks like there's nothing to report right now

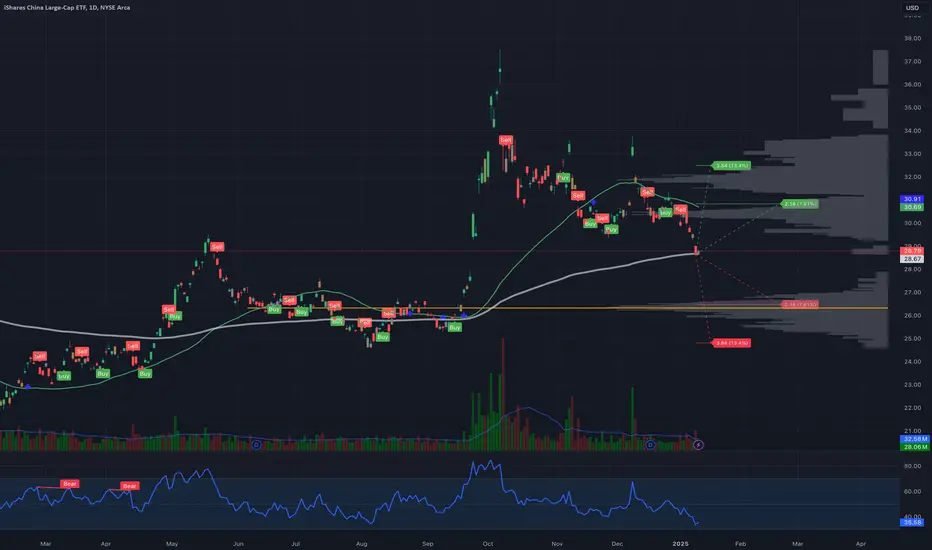
China Market Broder View This analysis is based on FXI ETF the iShares China Large-Cap ETF, which is trades on US stock exchange represents large-capitalization Chinese equities that trade on the Hong Kong ...
largest fall in Chinese market over 60 %, you can see volume-based buying near monthly support area which were rep

FXI ETF - what's your next move ?First thing first, congratulations to those who bought this ETF at the beginning of 2024. It has since climbed 70% from the bottom to the current price.
Now, we are at an inflection point. With an ambitious 5% GDP target and 2% inflation rate for 2025, the whole world is watching China for more st

FXI - Headed to 50As the "Made in America" - "Made in China" battle heats up, FXI projections may indicate that China will made strong advancements in its economy. How tariffs play into the scene is yet unknown, the chart patterns, including the extension formation makes me think that price can target the 2.618 meas


FXI options expiring on January 17 and February 21, the strategyFXI Technical Analysis: Testing Key Support Before Potential Upward Move on Policy Developments
Description:
In this analysis, we examine FXI (FTSE China 50 Index ETF) and its recent volatility trends between January 17 and February 21, 2025. FXI has seen a significant drop in implied volatility f
FXI - Solid Pick for 2025Reading about the Chinese auto companies this morning and seeing how their cheaper vehicles are bound to dominate. I spend time in Mexico and see the onslaught of cheap Chinese vehicles selling for $18,000. Seems that almost all articles I read mentioning China, I walk away thinking that China is

FXI to $55.00 someday ?FXI , the most representative ETF of the Chinese stock market, reflects, in our view, a 15-year stagnation that contrasts with the remarkable economic growth China has experienced during the same period.
Since May 2008, the FXI has unsuccessfully attempted to break above the $55.00 level, register


See all ideas
Summarizing what the indicators are suggesting.
Oscillators
Neutral
SellBuy
Strong sellStrong buy
Strong sellSellNeutralBuyStrong buy
Oscillators
Neutral
SellBuy
Strong sellStrong buy
Strong sellSellNeutralBuyStrong buy
Summary
Neutral
SellBuy
Strong sellStrong buy
Strong sellSellNeutralBuyStrong buy
Summary
Neutral
SellBuy
Strong sellStrong buy
Strong sellSellNeutralBuyStrong buy
Summary
Neutral
SellBuy
Strong sellStrong buy
Strong sellSellNeutralBuyStrong buy
Moving Averages
Neutral
SellBuy
Strong sellStrong buy
Strong sellSellNeutralBuyStrong buy
Moving Averages
Neutral
SellBuy
Strong sellStrong buy
Strong sellSellNeutralBuyStrong buy
Displays a symbol's price movements over previous years to identify recurring trends.
Frequently Asked Questions
An exchange-traded fund (ETF) is a collection of assets (stocks, bonds, commodities, etc.) that track an underlying index and can be bought on an exchange like individual stocks.
FXI trades at 36.06 USD today, its price has fallen −3.04% in the past 24 hours. Track more dynamics on FXI price chart.
FXI net asset value is 36.48 today — it's fallen 1.21% over the past month. NAV represents the total value of the fund's assets less liabilities and serves as a gauge of the fund's performance.
FXI assets under management is 6.17 B USD. AUM is an important metric as it reflects the fund's size and can serve as a gauge of how successful the fund is in attracting investors, which, in its turn, can influence decision-making.
FXI price has fallen by −0.61% over the last month, and its yearly performance shows a 33.65% increase. See more dynamics on FXI price chart.
NAV returns, another gauge of an ETF dynamics, have risen by −1.21% over the last month, have fallen by −1.21% over the last month, showed a 16.46% increase in three-month performance and has increased by 41.45% in a year.
NAV returns, another gauge of an ETF dynamics, have risen by −1.21% over the last month, have fallen by −1.21% over the last month, showed a 16.46% increase in three-month performance and has increased by 41.45% in a year.
Since ETFs work like an individual stock, they can be bought and sold on exchanges (e.g. NASDAQ, NYSE, EURONEXT). As it happens with stocks, you need to select a brokerage to access trading. Explore our list of available brokers to find the one to help execute your strategies. Don't forget to do your research before getting to trading. Explore ETFs metrics in our ETF screener to find a reliable opportunity.
FXI invests in stocks. See more details in our Analysis section.
FXI expense ratio is 0.74%. It's an important metric for helping traders understand the fund's operating costs relative to assets and how expensive it would be to hold the fund.
No, FXI isn't leveraged, meaning it doesn't use borrowings or financial derivatives to magnify the performance of the underlying assets or index it follows.
In some ways, ETFs are safe investments, but in a broader sense, they're not safer than any other asset, so it's crucial to analyze a fund before investing. But if your research gives a vague answer, you can always refer to technical analysis.
Today, FXI technical analysis shows the buy rating and its 1-week rating is buy. Since market conditions are prone to changes, it's worth looking a bit further into the future — according to the 1-month rating FXI shows the buy signal. See more of FXI technicals for a more comprehensive analysis.
Today, FXI technical analysis shows the buy rating and its 1-week rating is buy. Since market conditions are prone to changes, it's worth looking a bit further into the future — according to the 1-month rating FXI shows the buy signal. See more of FXI technicals for a more comprehensive analysis.
Yes, FXI pays dividends to its holders with the dividend yield of 2.63%.
FXI trades at a premium (0.27%).
Premium/discount to NAV expresses the difference between the ETF’s price and its NAV value. A positive percentage indicates a premium, meaning the ETF trades at a higher price than the calculated NAV. Conversely, a negative percentage indicates a discount, suggesting the ETF trades at a lower price than NAV.
Premium/discount to NAV expresses the difference between the ETF’s price and its NAV value. A positive percentage indicates a premium, meaning the ETF trades at a higher price than the calculated NAV. Conversely, a negative percentage indicates a discount, suggesting the ETF trades at a lower price than NAV.
FXI shares are issued by BlackRock, Inc.
FXI follows the FTSE China 50 Net Tax USD Index. ETFs usually track some benchmark seeking to replicate its performance and guide asset selection and objectives.
The fund started trading on Oct 5, 2004.
The fund's management style is passive, meaning it's aiming to replicate the performance of the underlying index by holding assets in the same proportions as the index. The goal is to match the index's returns.