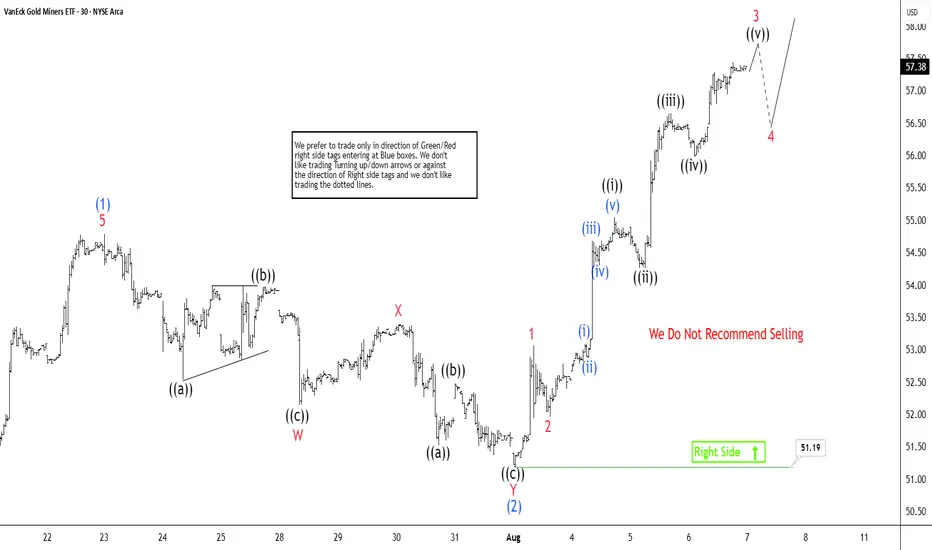
GDX Elliott Wave Outlook: Strong Wave 3 Surge with $58 3 TargetThe Gold Miners ETF (GDX) continues its upward trajectory, forming a pattern of higher highs and higher lows since its September 2022 bottom, signaling a robust bullish market. From the July 17, 2025 low, GDX has embarked on a five-wave impulse Elliott Wave structure in the shorter cycle. The hourly
Key stats
About VANECK ETF TR
Home page
Inception date
May 16, 2006
Structure
Open-Ended Fund
Replication method
Physical
Dividend treatment
Distributes
Distribution tax treatment
Qualified dividends
Income tax type
Capital Gains
Max ST capital gains rate
39.60%
Max LT capital gains rate
20.00%
Primary advisor
Van Eck Associates Corp.
Distributor
Van Eck Securities Corp.
GDX is one of the most popular funds in the global gold-mining segment, a trading powerhouse with deep primary, secondary and derivatives markets. Following a 2013 overhaul of the fund`s index, GDX is no longer limited to US-listed firms, nor does it filter out firms that have hedged their gold exposure with derivatives. In addition, it includes firms mining other precious metals in addition to gold, so it`s not entirely pure-play gold miners. GDX includes all the major names, but the fund`s broader take on the gold-mining space means that the big firms get less weight than in our neutral benchmark. As an industry benchmark, GDX falls a bit short, but it's still hugely popular.
Related funds
Classification
What's in the fund
Exposure type
Non-Energy Minerals
Stock breakdown by region
Top 10 holdings
Elliott Wave Insight: GDX Climbs Higher After Three Wave DeclineThe rally in the Gold Miners Junior ETF (GDX) from its December 30, 2024 low remains intact. This rally is unfolding as a five-wave impulse pattern, as observed on the 1-hour chart below. Wave (4) of this impulse concluded at $44.75, setting the stage for wave (5) higher. Wave (5) is currently progr

Gold Miners Break KEY multi-year resistanceIn the face of uncertainty, money flees to safe haven assets like Gold, Silver and the Dollar. When Gold moves up, gold miners do as well. As you can see from the weekly chart, the miners broke key resistance going all the way back to August 2020. These decade long highs at $46 were broken and there

Gold Miners Stocks Go 'The Rife Game' in Town. Here's WhyGold mining stocks have emerged as one of the top-performing asset classes in 2025, driven by a combination of surging gold prices, improved profitability, and shifting investor sentiment.
Here’s fundamental and technical analysis of the key factors behind this outperformance, by our @PandorraResea

Gold Miners (GDX) at Key Support, Set for Potential Upside MoveThe Gold Miners ETF (GDX) is showing promising signs for investors as it approaches a critical support zone. Since the low on December 30, 2024, GDX has been tracing a five-wave impulse pattern. This is a hallmark of bullish momentum in Elliott Wave analysis. The first wave (wave (1)) peaked at $42.

Trading Journal $GDX Bought as it tried breaking out...
Sold due to news event with US and China agreeing on 90 day pause trade deal. GLD reversed, markets went up..
Instituiton likely to sell their position and move into the companies now

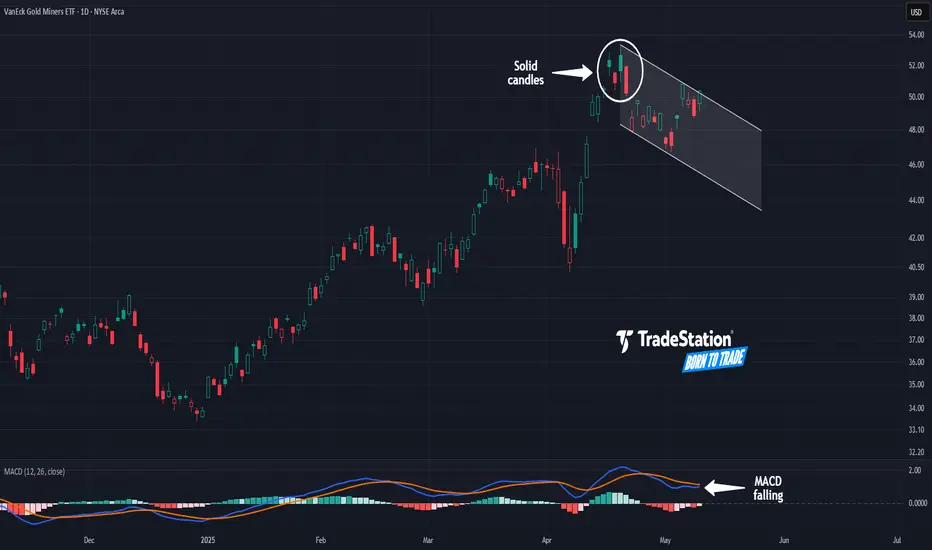
Gold Miners May Be FatiguedThe VanEck Gold Miners ETF had a major breakout in March, but some traders may think it’s getting fatigued.
The first pattern on today’s chart is the series of candles on April 16-22. Those bars occurred at the highest levels in almost four years. They’re also solid, illustrating that price wasn't
Sol GDX Review Studying the weekly and daily structure of GDX using ICT concepts: breaker blocks, order blocks, and liquidity. Looking for price reaction around the weekly order block and possible short-term displacement. Feedback and insights welcome!

SHORT GDX or LONG DUST // Swing TradingAfter correction of Gold (GLD) day before yesterday.
A equity market open for a risk-on scenario, maybe cooldown the gold rally for a while.
Today GDX filled the gap of the yesterday decline stopin at $50 (yellow mark).
Target $44-$45. First level of Fibonacci.

Gold Miners ETF (GDX) Surges in Strong Nested ImpulseThe Elliott Wave analysis for the VanEck Gold Miners ETF (GDX) shows a strong bullish trend since December 30, 2024. This rally forms a “nesting impulse” pattern with smaller waves building into an extended third wave. From the December low, wave (1) peaked at $42.66, followed by a wave (2) pullback

See all ideas
Summarizing what the indicators are suggesting.
Oscillators
Neutral
SellBuy
Strong sellStrong buy
Strong sellSellNeutralBuyStrong buy
Oscillators
Neutral
SellBuy
Strong sellStrong buy
Strong sellSellNeutralBuyStrong buy
Summary
Neutral
SellBuy
Strong sellStrong buy
Strong sellSellNeutralBuyStrong buy
Summary
Neutral
SellBuy
Strong sellStrong buy
Strong sellSellNeutralBuyStrong buy
Summary
Neutral
SellBuy
Strong sellStrong buy
Strong sellSellNeutralBuyStrong buy
Moving Averages
Neutral
SellBuy
Strong sellStrong buy
Strong sellSellNeutralBuyStrong buy
Moving Averages
Neutral
SellBuy
Strong sellStrong buy
Strong sellSellNeutralBuyStrong buy
Displays a symbol's price movements over previous years to identify recurring trends.
Frequently Asked Questions
An exchange-traded fund (ETF) is a collection of assets (stocks, bonds, commodities, etc.) that track an underlying index and can be bought on an exchange like individual stocks.
GDX trades at 58.25 USD today, its price hasn't changed in the past 24 hours. Track more dynamics on GDX price chart.
GDX net asset value is 58.25 today — it's risen 14.26% over the past month. NAV represents the total value of the fund's assets less liabilities and serves as a gauge of the fund's performance.
GDX assets under management is 17.05 B USD. AUM is an important metric as it reflects the fund's size and can serve as a gauge of how successful the fund is in attracting investors, which, in its turn, can influence decision-making.
GDX price has risen by 12.11% over the last month, and its yearly performance shows a 58.12% increase. See more dynamics on GDX price chart.
NAV returns, another gauge of an ETF dynamics, have risen by 14.26% over the last month, showed a 15.38% increase in three-month performance and has increased by 68.71% in a year.
NAV returns, another gauge of an ETF dynamics, have risen by 14.26% over the last month, showed a 15.38% increase in three-month performance and has increased by 68.71% in a year.
Since ETFs work like an individual stock, they can be bought and sold on exchanges (e.g. NASDAQ, NYSE, EURONEXT). As it happens with stocks, you need to select a brokerage to access trading. Explore our list of available brokers to find the one to help execute your strategies. Don't forget to do your research before getting to trading. Explore ETFs metrics in our ETF screener to find a reliable opportunity.
GDX invests in stocks. See more details in our Analysis section.
GDX expense ratio is 0.51%. It's an important metric for helping traders understand the fund's operating costs relative to assets and how expensive it would be to hold the fund.
No, GDX isn't leveraged, meaning it doesn't use borrowings or financial derivatives to magnify the performance of the underlying assets or index it follows.
In some ways, ETFs are safe investments, but in a broader sense, they're not safer than any other asset, so it's crucial to analyze a fund before investing. But if your research gives a vague answer, you can always refer to technical analysis.
Today, GDX technical analysis shows the strong buy rating and its 1-week rating is strong buy. Since market conditions are prone to changes, it's worth looking a bit further into the future — according to the 1-month rating GDX shows the strong buy signal. See more of GDX technicals for a more comprehensive analysis.
Today, GDX technical analysis shows the strong buy rating and its 1-week rating is strong buy. Since market conditions are prone to changes, it's worth looking a bit further into the future — according to the 1-month rating GDX shows the strong buy signal. See more of GDX technicals for a more comprehensive analysis.
Yes, GDX pays dividends to its holders with the dividend yield of 0.69%.
GDX trades at a premium (0.16%).
Premium/discount to NAV expresses the difference between the ETF’s price and its NAV value. A positive percentage indicates a premium, meaning the ETF trades at a higher price than the calculated NAV. Conversely, a negative percentage indicates a discount, suggesting the ETF trades at a lower price than NAV.
Premium/discount to NAV expresses the difference between the ETF’s price and its NAV value. A positive percentage indicates a premium, meaning the ETF trades at a higher price than the calculated NAV. Conversely, a negative percentage indicates a discount, suggesting the ETF trades at a lower price than NAV.
GDX shares are issued by Van Eck Associates Corp.
GDX follows the NYSE Arca Gold Miners. ETFs usually track some benchmark seeking to replicate its performance and guide asset selection and objectives.
The fund started trading on May 16, 2006.
The fund's management style is passive, meaning it's aiming to replicate the performance of the underlying index by holding assets in the same proportions as the index. The goal is to match the index's returns.