GDX trade ideas


MINERS ARE BE(NG SHORTED TO KEEP GOLD SUPPRESSEDBIG MOVE UP COULD BE INCOMING, I THINK this could drop another $3-5 but I don't wanna miss a huge move.

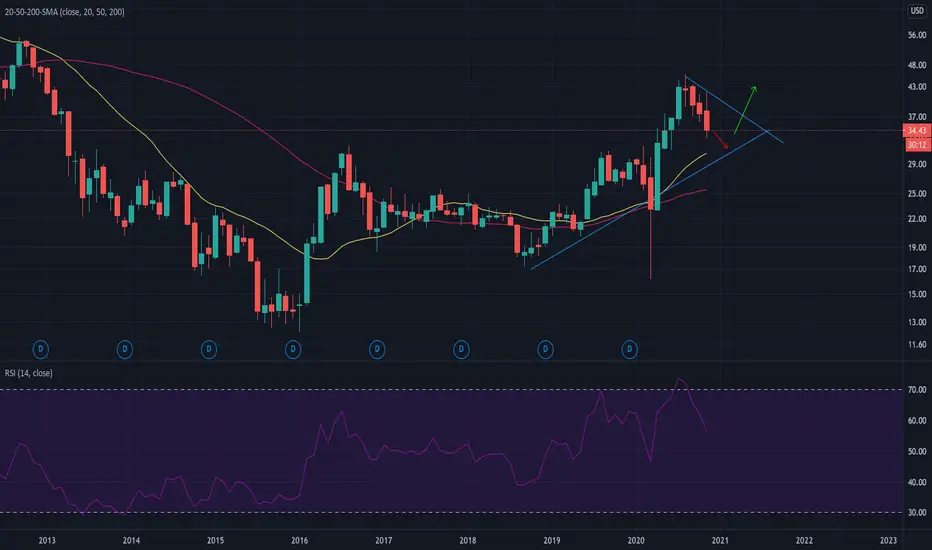
GDX - ready to break out ?GDX is bullish against the last low. Same for GDXJ.
There's no sure thing - you trade what's in front of you.


Price rejection, possible move lowerMay continue down to major price support line. lets hope this is the last one.

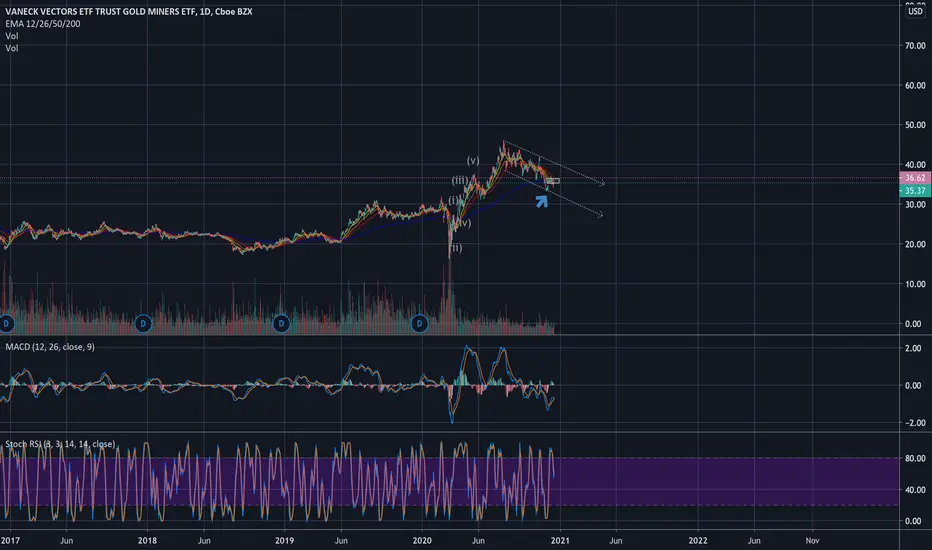
Elliott Wave View: GDX Ended Correction and Ready to Resume HighElliott Wave view in $GDX suggests that the Gold Miner Index ended cycle from March low in wave ((2)) at 33.16. The Index has turned higher again in wave ((3)) with the internal unfolding as an impulse Elliott Wave structure. Gold Miners still need to break above previous wave ((1)) high on August 5 at 45.78 to avoid a double correction. Up from wave ((2)) low at 33.16, wave ((i)) ended at 34.5 and wave ((ii)) pullback ended at 33.35. Gold Miners then extended higher again in wave ((iii)) towards 36.07, and pullback in wave ((iv)) ended at 35.7. Final leg higher in wave ((v)) ended at 36.4 and this completed wave 1 in higher degree.
The Index then corrected cycle from November 24 low and ended wave 2 at 34.87. Internal of wave 2 unfolded as a double three structure where wave ((w)) ended at 35.23, wave ((x)) ended at 35.81, and wave ((y)) ended at 34.87. Up from wave 2 low, wave ((i)) ended at 36.92. Expect wave ((ii)) pullback to stay above wave 2 at 34.87, but more importantly above 33.16. As far as pivot at 33.16 low stays intact, expect dips to find support in 3, 7, or 11 swing for more upside. Potential short term target higher is 100% – 123.6% Fibonacci extension from November 24 low at 38.09 – 38.86.

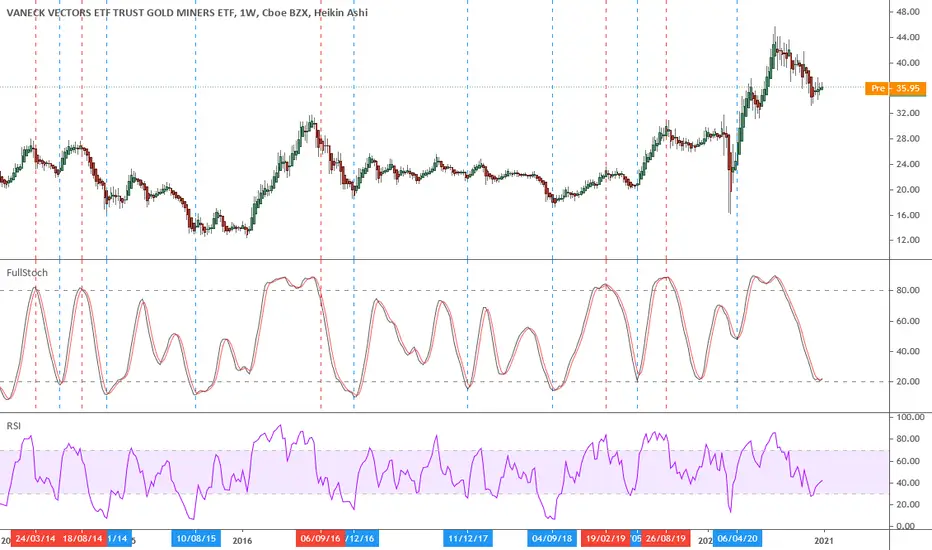
GDX - GOLD MINERS ETF- After dipping under the 200 day moving average, buyers have bid the price back up and the share is poised to continue its up trend.
- Stochastics moving off oversold
- Major support area at $31.34
- This zone can continue to be tested and consolidate before making a new leg so i will be scaling into a trade .
- Current fundamentals regarding stimulus / dollar will have a major role to play for the gold price
-- MANAGE YOUR RISK - -
Disclaimer: All ideas are my opinion and should not be taken as financial advice.


GDX - Bear TrapIt looks like the correction in gold/gold miners is over and GDX is ready to move higher. On 12/1, GDX broke back above resistance. Bear traps typically result in a big rally as the shorts get squeezed out.


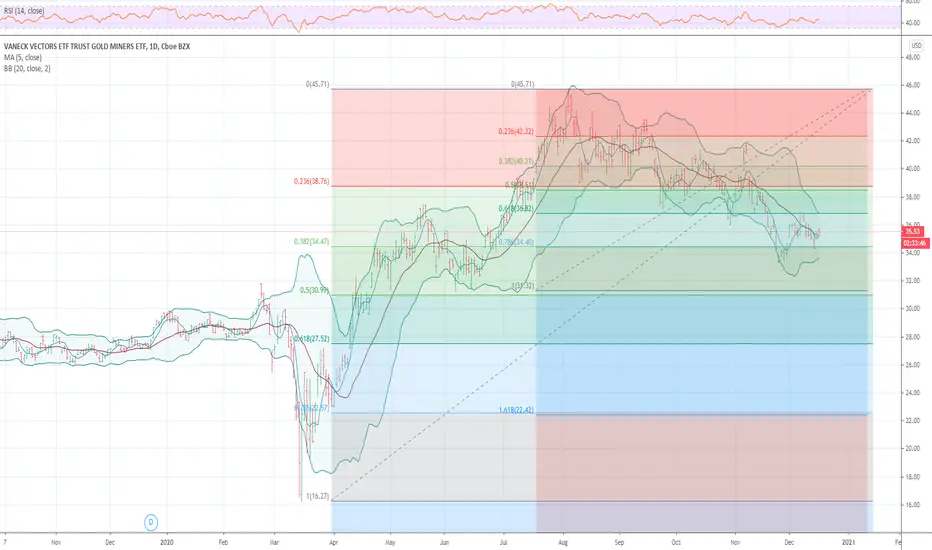
GDX ENTERING INTO BUY ZONE "shopping in the box"GDX will see another wave down. People are getting too eager to buy this. If you are picking bottoms this sure as hell does not look like the one you should be betting on.


dips almost donelook for a dip entry around 28-30, thats where id start looking for some calls or shares :D its looking pretty red for miners atm though so be careful
GDX Gold miners: looking for 1 more bounce upIn April I thought GDX looked positive and it turned out to be correct (see link below). I still favor we have one more pop up before a possible major correction. Looks like a bull flag now. I close below the flag would be negative. Process your way, Have a great weekend,

Exciting times ahead.. GDXin LIMBO right now
If there is a bigger market pullback.. Expecting #BTFD between 28 ish or 27.50
Otherwise all good and we enter the flag again


GDX LongAt downtrend channel bottom
Touch Demand Zone
Entry 34
Stop 31
Target 45
I am not a PRO trader. I need few months to practice trading strategies.
If you like this idea, please use SIM/Demo account to try it, until my trading plans get high winning rate.
Today, I also long GLD, AUY, GOLD, KGC, MUX, NGD, KL; (FNV, SBSW, GFI pending order, NEM was bought last week, RGLD watch only )
