Hard time ahead for GDX and GoldOn the chart we see nice 5 wave move down from 2011 till 2016 followed by 61% running flat correction topped in Aug this year. This probably can give us some clue on whether the following Gold price fall is a short term correction or a beginning of a long term down trend. I would bet the latter.
GDX trade ideas
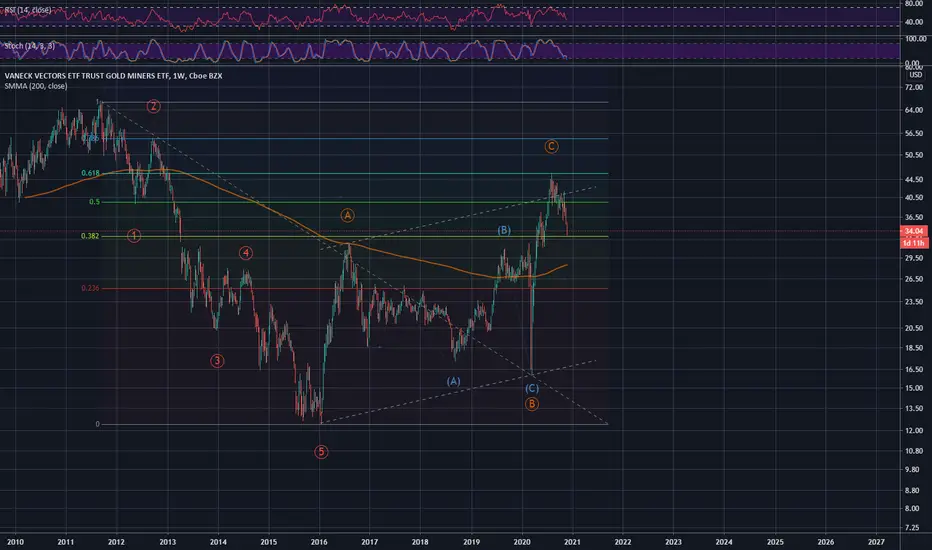
GDX - gold minersThe good news is that we are approaching some serious levels
The bad news is the way we crushed the 200MA

GDX 45 call expiry : jan 2022 cost:2.09$ cmp:33.5 SL: below 31 GDX 45 call
expiry : jan 2022
cost:2.09$
cmp:33.5
SL: below 31
24/nov/2020

GDX Short term DowntrendThe Gold miners index is in downtrend on the daily chart in the short term. With the gold prices moved down the decisive 1800 level the GDX broke down the 200 EMA. On the weekly chart the 100 EMA may act as support at the 30 to 31 level if it further breaks down on the daily chart.

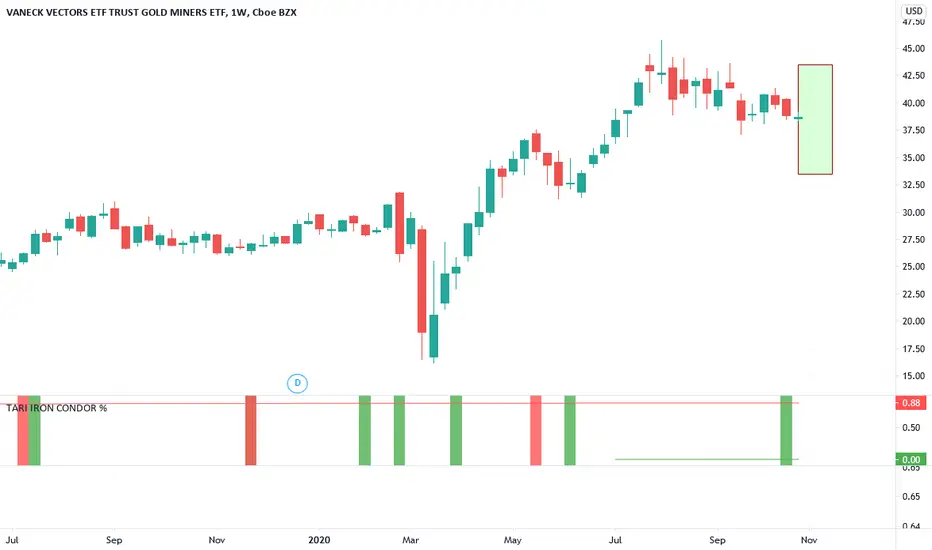
Iron TariHi guys,
As explained in many other ideas I shared, follow the strtaegy, iron condor, strangle, do the maths and enjoy!
Enjoy your wallet!
Tari.
GDX - Crossing 200ma Daily- As gold has be sold back, GDX ETF has worked its way towards the 200ma on the daily.
- I will become interested around the $31.50 level on signs of support.
- No position currently
AMEX:GDX
-- MANAGE YOUR RISK - -
Disclaimer: All ideas are my opinion and should not be taken as financial advice.

GDX pushing further down to target !As previously observed, analyzed and projected... GDX is going down hard.
There is a current rotation ongoing, and GDX needs to retrace strongly, base out and rotate back in again.
Wait for it...


Miners - does money flow from Big Caps -> Mid Caps -> Juniors..?A quick & dirty examination of the thesis that money always flows from Big caps -> Mid caps -> Juniors.


GDX should have some deadcat bounce from hereGDX should bounce from here, though the intermediate still ahead

Elliott Wave View: GDX Correction Remains in ProgressElliott Wave view in Gold Miners (GDX) suggests the Index is correcting the cycle from March 16, 2020 low. The correction is unfolding as a double three Elliott Wave Structure. In the 60 minutes chart below, we can see wave (X) of this double three ended at $42.05. The Miners have turned lower in wave (Y).
The internal of wave (Y) is unfolding as a zigzag Elliott Wave structure. Down from wave (X) high at $42.05, wave ((i)) ended at $38.03, and bounce in wave ((ii)) ended at $39.24. Index resumes lower in wave ((iii)) towards $37.52, wave ((iv)) ended at $37.87, and wave ((v)) ended at $36.73. This ended wave A of (Y) in higher degree.
Index then bounced in wave B which ended at $38.42. Internal structure of wave B unfolded as a zigzag where wave ((a)) ended at $38.08, wave ((b)) ended at $37.39, and wave ((c)) ended at $38.42. The Gold Miners have extended lower in wave C. Down from wave B high at $38.42, wave ((i)) ended at $37.83 and wave ((ii)) ended at $38.29. Expect a few more lows in the Index to end wave C of (Y) before GDX finds support. A potential support area is 100% – 123.6% Fibonacci extension from August 5, 2020 high which comes at $31.05 – $33.10.


GDX monthly is clearerObviously, close this month below 36 would be bad ... at least need another month or two to reverse.
Close between 36 and 40 hits buyers are trying to test water and see how much resistance it has. So the chance that December will be higher is ~ 2/3.
Close above 40 in November means buyers are ready to bring it higher, can take some risk in monthly options.

Goldminers swing tradeGold and goldminers set for a rebound to test the top of the regression channel, after the set down following the recent vaccine news.


GDX Biggest Bull Flag in the history of Bull FlagsIt's not a matter of if, it's a matter of when gold breaks out dramatically. Everyone knows that. For my money, GDX looks like the biggest bull flag I've ever seen. But! The US election crazy is not over . We're right in the middle of the flag range. But I could see it going either way. Just like the US election. As of today, I'm leaning 61.8% towards UP and buying accordingly.

GDX - ready to break out ?For now, I am labeling this as 1 - 2 down. In comparison to the $Gold index, GDX held pretty good, retracing only down to %62 area.
Metals have some head wind though, like the rising yield and $dollar. This week is going to be interesting.


GDX : Tentative Signs of LiftoffGDX has broken and closed above its trendline and now needs to either shoot higher or consolidate its position above there before soaring. A break back below the trendline would suggest a fake breakout, but until then, like Gold, the bulls are in charge.
