GDX trade ideas


GDX just giving way...Tracking gold, one can buy GDX, the Gold Miners ETF, and the associated specific funds.
Having tracked Gold closely for the past three years, the white arrow marks a rough but a real exit point.
Today the perfect storm is set... and pre-opening shows a gap down type of breakdown.
Previously explained why and how GDX would not be doing well and when it should be doing well. IMHO, This is probably a deep retracement.
Fun times to come!
Here it goes part II.

Mining for Gold: GDX Daily ChartGDX is currently inside of two triangles and nearing the narrow-angle of the triangle. With that said, we are looking for GDX to either break up or break down. i don't know which way it'll turn but will start preparing for a move one way or the other.
Here is what I am seeing:
It looks like GDX is sitting on the edge of triangle 1 and could go lower to the second triangle which offers support at around the 40 to 40.50 range. If support at 40 fails, the next level of support is at 37.75. both of these prices are good buying opportunities.
There is a good chance that there will be a momentary bounce early Monday morning with resistance at around 43 to 43.50. GDX may be able to blast through that resistance and test the previous high at 46. If you are bullish on GDX you may want to consider option spreads on GDX
Watch out for head fakes and look for confirmation on a directional move.
Best wishes are you mine for gold.


GDX - Interesting spot!GDX - miners starting to perk up again. In an interesting spot in the flag. Still some overhead resistance but with a little oomph it should be able to get thru. I was looking for this to trade back down to 38 again before a move up (and even 36) but metals are hanging in there and the miners seem to want to rise too. Could be a huge head fake but don't want to miss out completely if they are ready for next leg up. Macro environment very favorable. Started some long positions again today.

GDX H1: SWING: Accumulation / BUY DIPS 20% gains (SL/TP)(NEW)Why get subbed to to me on Tradingview?
-TOP author on TradingView
-15+ years experience in markets
-Professional chart break downs
-Supply/Demand Zones
-TD9 counts / combo review
-Key S/R levels
-No junk on my charts
-Frequent updates
-Covering FX/crypto/US stocks
-24/7 uptime so constant updates
GDX H1: SWING: Accumulation / BUY DIPS 20% gains (SL/TP)(NEW)
IMPORTANT NOTE: speculative setup. do your own
due dill. use STOP LOSS. don't overleverage.
🔸 Summary and potential trade setup
::: GDX 1hour/candle chart review
::: TP BULLS is 20% gains soon
::: BUY/HOLD SETUP
::: chart looks strong right now
::: strong bottom confirmed with 3 tests
::: expecting more gains after DIP
::: BULLS should focus on buying DIPS
::: September strong month SILVER / GOLD
::: recommended strategy: BUY DIPS
::: near 41.50 best reload BULLS
::: TP BULLS is 20%+ gains
::: if there's a mild dip just buy it
::: BUY/HOLD - swing trade settup
::: SWING trade setup do not expect
::: fast/miracle overnights gains here
::: good luck traders
🔸 Supply/Demand Zones
::: N/A
::: N/A
🔸 Other noteworthy technicals/fundies
::: TD9 /Combo update: N/A
::: Sentiment short-term: pullback/DIPS
::: Sentiment outlook mid-term: BULLS/REVERSAL

[Long] Gold minersFantastic swing low off the 50 dma.
MACD all reset.
GVZ down to 20 handle.
I see intraday relative strength vs SPY. Hope this sector shakes off its correlation with DXY and SPY and starts moving on its own terms.
SAND LGDTF KL EQX WPM WLBMF


GDX correct from here?surprised to see GDX has such a huge divergence on the weekly chart dated back so long.
if you see value in this analysis please give a like. thanks.

LAST MAJOR RALLY IN GOLD STOCKS STARTS NOW The chart posted is that of my top wave structure in gold stocks . this also shoul give the sp the last pop in a 5th wave is now very high . cycles due to peak from aug 25 to sept 10 fucus was 9/4 peak 9/2 into fib targets 3885 to 3618 I still feel that we will 3618 and iwm to run as well. the FED is now in position to lead us in the next wave up
Gold Miners - the cards stacked up against, to fall...It’s done.
With gold being on the retracement, and perhaps a large one at that, the gold miners (ETF, GDX) is under siege and under pressure to retrace hard.
Technically, despite a long tail, GDX clocked a lower low, which broke down of a support line briefly. The MACD is clearly broken down ahead of price.
So, what is the risk?
Plenty... the miners tend to do well under conditions where gold as a commodity is in a bull rally, borrowing rates are low, and particularly, that equities are rallying.
The S&P500 as well as major indices like the Nasdaq leading the downdraft of late, accentuating the risks to the Gold miners.
Given all the factors, it would appear an insurmountable effort for the miners to stage a huge rally out of the technical backdrop. Not that it’s impossible, but it has very low probability.

GDX getting ready for 54.. GDX getting ready for 54.. Bull flag again visible in GDX.... we have been waiting for pattern to form...
stop loss 35 since stop loss is huge... you can also wait for GDX break out of the trend to avoid huge loss or buy near support of the flag...in case it reverses..


GDX more upside aheadBut wait until b/o.
High chance it will break out, but whether it can make new highs directly is not that clear. So either:
1. use short term options and take 2/3 profits when close to prior high
2. use long term and hedge with short term put when close to prior high
Depending on your longer term view. The idea is: if prior high was the top, one should see heavy sell off near 44 & 46 (i.e. strong intra-day reversal). Or it should not b/o the triangle at all.

GDX daily chart - looks like the pullback is overIt is breaking out both for the price and the RSI, RSI is above 50 and MACD is positive.

$GDX (+18.47%) + $SLV (+53%) {HOLD}From two original buy signals given here on my profile linked below.


🍾Warren Buffet joins Schiff - who is else is coming the party?If there was any doubt that the gold miners are not about to start a new bull market, that doubt has been squashed by Berkshire Hathaway buying some Barrack Gold.
Before this news I was expecting the GDX to go as low as $32 in this corrective move, but the cats out the bag and I’m sure bigger players will start entering into this space in the coming weeks/months (hedge funds etc).
From the $45~ top we’ve gone as low as $38~ which looked like a blow off top like we saw in gold. On top of that there was some bearish divergence between price and RSI that I have highlighted in yellow.
The bounce from this level backtested the old trend line and it looks like the next move is lower.
The gold chart looks be in a corrective phase too which gives me greater reason to believe the GDX will follow suit (you can see my gold chart by checking out my profile).
The first area to add to longs is the $37, this has been a major support/resistance where I expect a bounce.
If that level does not hold, a while back I thought we would make the move all the way down to $32~, but that seems rather unlikely thanks to Warren, instead I’d welcome prices to hit $35-$34 level, the GDX did face some heat at this level in May and June.
Have any questions about the GDX in the short-term? Leave a comment below.

PeaksLooks like a triple top / head & shoulders, archipelago, temporary top.
A break of the trendline which I think has just happend, opens up some lower levels before going up.
Not a trading recommendation, just my personal analysis.

Gold Miner ETF Pulls Back but the Trend Seems IntactGold and silver have been explosive recently as the U.S. dollar slides and the Federal Reserve keeps interest rates low. The Market Vectors Gold Miners ETF pulled back between August 6-11, not a surprise given the pace of its rally. But the trend remained intact and now momentum followers may be active.
Last week’s retreat landed GDX back around the July 9 peaks, which briefly offered resistance before the ETF broke out to new seven-year highs.
The candlesticks on August 11 and 12 are also interesting. Both looked bearish on the surface because GDX closed at the lows. However the second day formed an inside bar. It’s similar (not exactly) to a morning star pattern, with short-term bearishness exhausting itself at a key support level.
Meanwhile, stochastics showed deeply oversold conditions at the same time.
GDX leaped yesterday. It tried to jump again this morning, but the bulls were too eager. Profit-takers drove it down early but they did no damage to the bullish trend. Now buyers are defending the 20-day simple moving average (SMA).
Finally, currency markets support the strength in precious metals, with the U.S. Dollar Index hitting a new two-year low today.

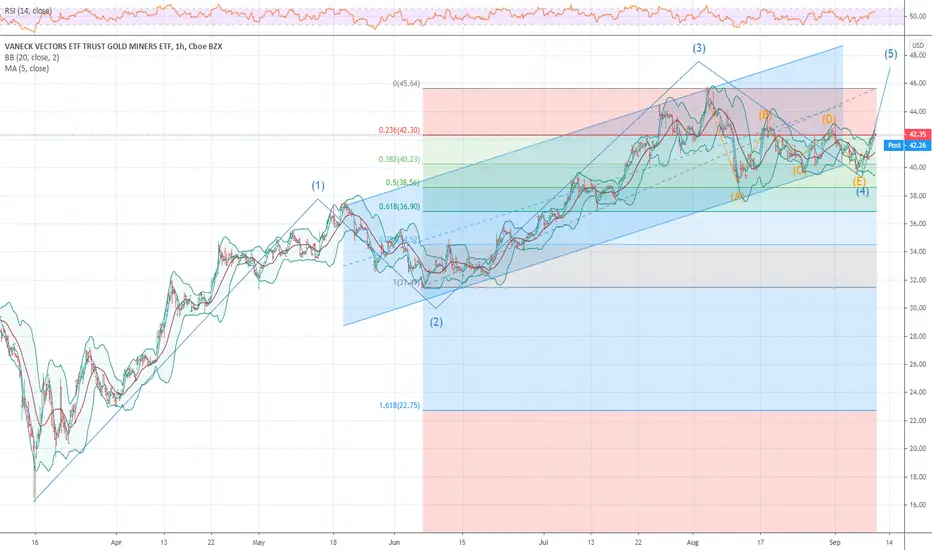
Elliott Wave View: Gold Miners (GDX) Ready to Resume HigherGDX 45 minutes chart below shows that the stock has ended the cycle from June 5 low as wave (3). The rally ended at 45.78 high. From there, the stock did a pullback in wave (4), which unfolded as a zigzag Elliott Wave Structure. Down from August 5 high, wave A ended at 42.25 low. The bounce in wave B ended at 44.18 high. Afterwards, the stock resumed lower in wave C, which ended at 38.82 low. This ended wave (4) in larger degree.
Afterwards, the stock has resumed higher from wave (4) low. Up from that low, the stock ended wave ((i)) at 40.69 high. Wave ((ii)) pullback ended at 39.05 low. Currently wave ((iii)) is in progress, where wave (i) of ((iii)) ended at 41.03 high and wave (ii) ended at 39.72 low. As long as pivot at 38.82 low stays intact, the dips in 3,7 or 11 swings is expected to find support for more upside. However, the stock still needs to break above wave (3) high at 45.78 to confirm that wave (4) is already in place and the next leg higher in wave (5) has started. Otherwise, the stock can still do a double correction in wave (4).

