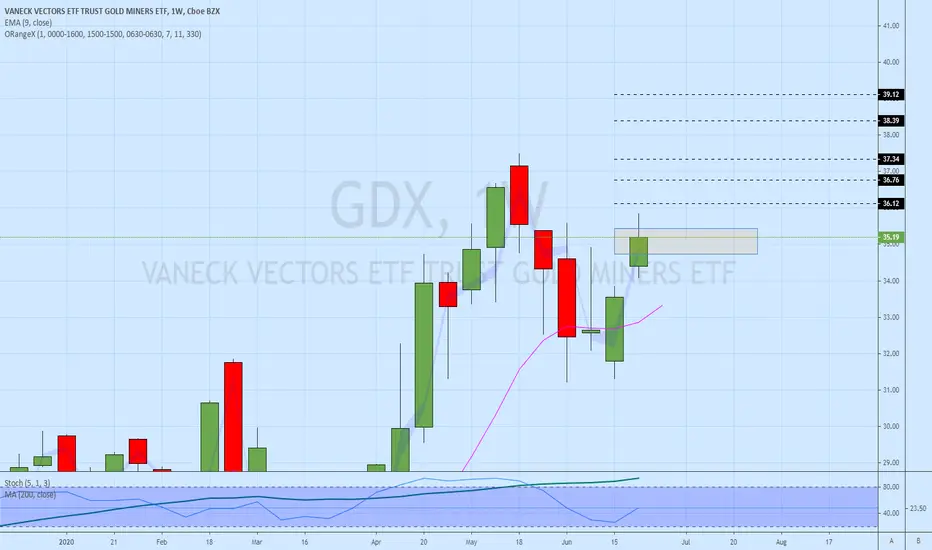
Gold Miners: Be Careful, Ascending Wedge EmergingI'm only in this for a small play but I did not want today to happen. I'm still short GDX but from the dotted line you can see where I will exit the trade.
GDX trade ideas


bull minners long term in high tfminners bull long term still up trend in the way to make new high 2020

!SLV, !GDX Long Entries: 13:25:28 (UTC) Mon Jun 29, 2020!SLV, !DGX Long Entries: 13:25:28 (UTC) Mon Jun 29, 2020

GDX - Ready to Attack!After consolidating for the better part of two months, GDX is set to attack the next FIB levels. I expect it will be successful given the indicators. MACD crossover and RSI turning up. Selling on lighter volume through the bull flag. Moving averages all turning up. Really not much not to like.

GDX Clearly broken out - Targeting 46As shown in the daily GDX chart, the turquoise trend lines mark the support resistance trend lines, as well as show a standard flag pattern. Previous upside target in 2019 was 36, it now is upgraded to 46, based on chart pattern and Fibonacci projections.
Recent price action saw a gap above the trend line resistance, and consolidation before yet another gap up (over a minor parallel trend line resistance).
Also observed that MACD is supportive with a break up cross into the bullish territory, and a break above the MACD trend line at about the same time.
Bullish, target 46, around mid-August 2020.


Keep an eye on GDXGDX is the ETF for gold miners.
This sector has been beaten down severely since its 2010-11 highs, when everyone was hedging against printing from Bernanke. If only we knew then what Powell would have become...
GDX has broken out the $32 resistance, which has acted as a strong support in the last month.
If Gold AUG futures (left axis, in orange) manage to get through the $1800 resistance, it is just a matter of time before we get in the mid 40s. That would represent my target in a few months, especially given that the equities market is not pricing in at all the possibility that Democrats take Senate and Presidency.
Buy GDX or even better long term calls dur to the recent consolidation.

GDX UpdateGDX holding above the cloud is bullish. However, 35.5 is still the key to determine the next step.
> 35.5 = long
otherwise = short


Gold Miners GDX just broke out - Target 46With almost a 30% upside full potential, the GDX broke out of a down trend resistance line, with MACD crossing over into the bullish territory. The GDX also nicely bounce off the 55EMA and registered a recent higher high.
System Buy signal activated.
Rather bullish signal, don’t you think?
Projections put the upside target at 46, with pauses along the way.

Gold Miners Looking to Confirm the Bullish BreakoutGDX has broken out of multi-year triangle that formed a solid base since 2015. If gold continues marching towards all time highs, I think GDX can hold the breakout here. Perhaps it will cool off for a couple weeks after the rapid rise, but then I'm looking for the move to low $40's on the way to $60+
Positions:
GDX 1/15/21 40c
GDX shares
Reassess if falls back into the triangle (convincingly <$30)

GDX higherMACD indicator is bullish and recently positive. RSI has room to go. There's a recent gap that will likely be filled, then its higher from there.

GDX hedge / shortIf GDX can not get above 35.5 (yellow tile), there is a chance the prior down wave from 38-31 is five and 35.5 is prior 4th wave.
GDX really has to get above it, otherwise we may face the so called 3rd wave.
I'd like to use Aug 28 or 29 as hedge (already loaded some today, and I already convert my long to vertical spread), if truly 3rd wave, target is 25 ish. Can be 6-7x easily.

Buy the next dip bull flag breakoutWe didn’t get as big of a pullback on Gold as I was hoping for, but Silver is overbought on daily, 4hr, 1hr, Gold has more room than Silver.

GDX : HEDGE FOR MARKET UNCERTAINTIESGDX is a fund that invests at least 80% of its total assets in common stocks and depositary receipts of companies involved in the gold mining industry. Miners have lagged actual Gold prices (XAUUSD) potentially due to operational risks affected by COVID19. The chart now looks set-up for a move higher to catch up with gold spot price as it breaks out from consolidation.
In times of an extended market and uncertainties, it's never a bad idea to hedge positions with exposure in gold to be well-prepared when the market turns.

GDX showing bullish pattern above 34 might target 37GDX showing bullish pattern above 34 might target 37 . GDX showing bearish wedge bullish pattern.. A break 34 above confirm completion of wedge and target is 37 and stop loss is around 33..
GDX at the trendlineNeeds to break out to support a short term trend change. Otherwise, more selling can come.

GDX - IMPENDING DOOM!!We can see from this chart that price is ready to drop!
It has hit a key level of support and bounced off, it has tested this area several times before going higher each time.
The last time this level was broken it was a freefall to the bottom.. The next time the drop may be even greater!!
Get the sell stops in!

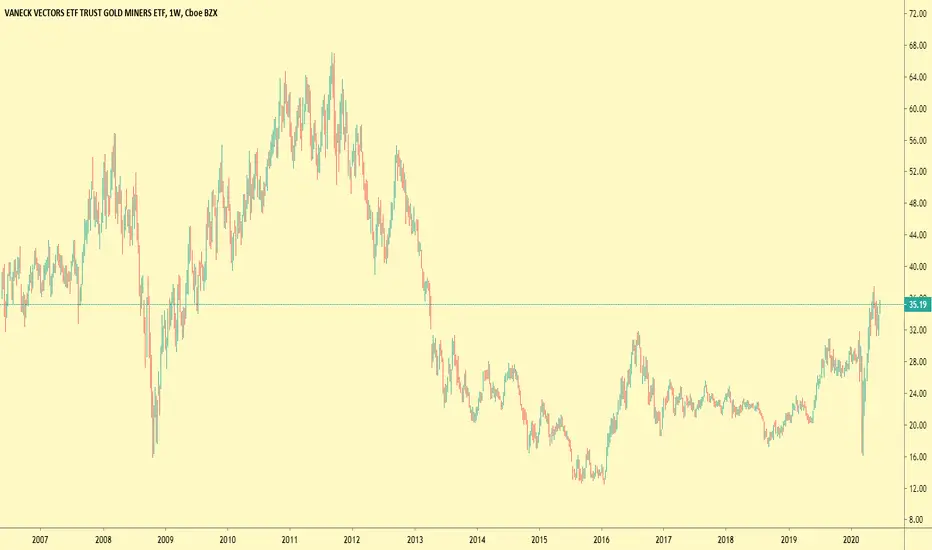
The $GDX (Gold Miners ETF) is Found Strong SupportWeekly Chart :
A very Clumsy Bullish Trend has started in 01/2016, and have been confirmed officially on the Penetration of the MDT (Major Down Trend) in 01/2019.
Note the Retest of Both Major Down Trendline and Major Up Trendline which occured on 03/2020 (covid-19 Drop) - Looking Positive.
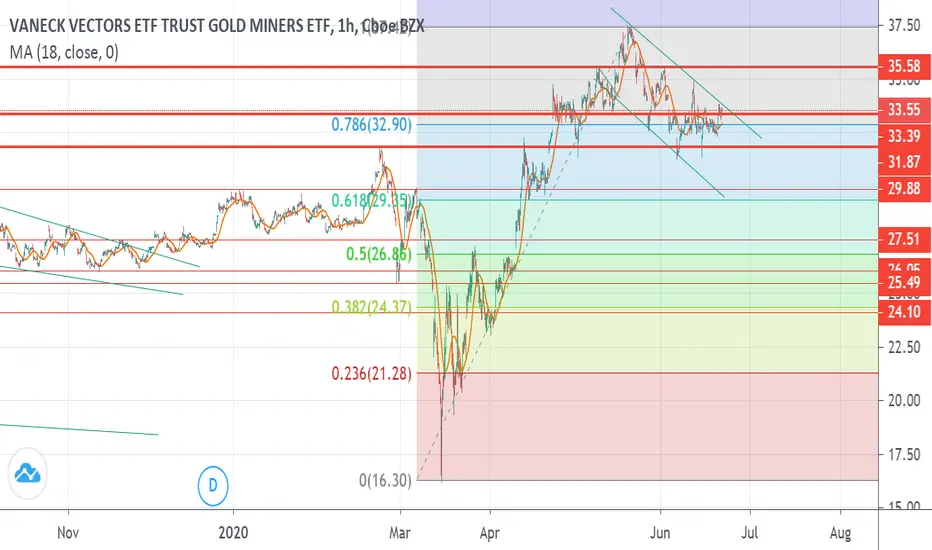
Daily Chart :
31.3 Broke up with a gap and turn from Resistance level to a Support level.
Backed up with Rise in Gold Price, i'm Looking for a Penetration of the last Minnor Down Trendline.
The Take Profit objective is 40.25

