$GDX may find some resistance short term$GDX testing UTL resistance along with a few other miners. Confirmation with break of LTL.
GDX trade ideas

GDX is a no brainerThis is just an obvious buy to be on this big breakout this week. I have been holding $NEM and $GOLD for a few weeks and they have already gone up 25% in price, while GDX has just really broken out on the whole. As the FED pumps the stock market the fundamentals of these mining companies are hard to beat.

GDX rocket to propel as long 31.65 is heldGDX rocket to propel as long 31.65 is held and looking for a target 45 within few months.. But GDX may test 31.65 line if it turn bearish due to any ... if u get that buy around 31.75 to 32.5 with strict stop loss of 2% since this is highly volatile and ride it till 45 with patience.
If u are already long keep stop loss at 2% below 31.65 around 31 and ride till 45..


GDX Breaks out from a 7 Year ResistanceGDX breaks out from a 7 year Resistance and looks to head higher to 55 in the next year. Fueled by rising gold prices and low oil prices.

GDX - breakout!Finally, miners confirming next move up in gold. 7 year highs. NEM broke out two weeks ago and now the index. This should be fun!

GOLD Miners BreakoutGold miners is coming out a long long long consolidation and finally broke out of it. With all the money being pumped into the economy, investors are starting to look for scarce assests.

Elliott Wave View: GDX Extends Higher to 7 Year HighElliott Wave view in Gold Miners ETF (GDX) suggests the rally from March 16, 2020 low is unfolding as a 5 waves impulsive structure. Up from March 16 low, wave (1) ended at 27.21 and pullback in wave (2) ended at 23. The ETF then extends higher in wave (3) towards 32.27 and wave (4) pullback ended at 29.37. The 45 minutes chart below shows the internal of wave (3) which unfolded as another impulse of lesser degree.
Wave (4) correction ended as a triangle. Wave A ended at 29.37, wave B at 31.12, wave C at 29.45, wave D at 31.13, and wave E of (4) ended at 29.45. The instrument then extends higher again in wave (5) with potential to end at 32.61 – 33.87 (blue box). This move will also complete wave ((1)) and thus ends cycle from March 16, 2020 low. Afterwards, the instrument can see larger pullback within wave ((2)) to correct cycle from March 16, 2020 low in 3, 7, or 11 swing before turning higher again.
We don’t like selling the instrument and GDX can always extend higher as the structure is in 5 waves. Furthermore, the sequence from January 2016 low appears incomplete with 100% – 123.6% Fibonacci target towards 36 – 40.6.

Gold miners ETF 30min chartconsolidating nicely, breaking out of one wedge, and now holding strong. a break of 31 should give way for a quick move to 32 retesting the multiyear resistance above. $GDX $NUGT $GLD


Gold Miner ETF at Long-Term Resistance as Optimism SpreadsGold and gold miners have been some of the go-to names in these days of coronavirus and cratering GDP growth.
The Market Vectors Gold Miner ETF has rallied sharply in the last month as investors look for firehoses of liquidity to boost precious metals. But that’s placed it at risk of conditions improving. What if the crisis starts to lift? What happens to gold if investors rotate back to cyclical parts of the market like banks and industrials?
The price chart may be reflecting those possibilities because GDX has been unable to close above $31. (This has been a key resistance area since running back to April 2013.) This week had another failure at that level – despite physical gold inching to a new high.
The resistance around $31 is now a potential risk-management level. GDX also has liquid options, creating the potential for income traders to sell credit spreads.
Overall, a lot of bullish news is priced into GDX at this level. But that also creates downside risk in price if conditions improve on Main Street.


GDX wave 4 is in progress need to be retrace 30.8 and then fall GDX wave 4 is in progress need to be retrace 30.8 to 31.5 and then fall towards 27.7
The B wave of Wave 4 is in progress and expected to retrace 50% or 61.8 or 75% (Between 29.88 to 32.22)
If 27.7 does not hold please close your long as we can expect more sharper large drop

GOLD ETF 1D ASCENDING TRIANGLE LONG TRADEAscending Triangle are repeatable trading chart patterns.
Ascending Triangle chart patterns will have a directional bias depending on the previous incoming trend.
Each chart pattern will have defining trendlines of the support/resistance levels creating the pattern.
What ever time frame you are trading this chart pattern, wait for a candle close outside of the trendline in the direction of the breakout candle. (Our time frame preference is the Daily chart).
Add volume indicator - Volume is the amount of $ that went into a particular candle or in Forex the # of trades that took place.
Add ATR indicator - Volatility is the amount of price movement that occurred. Use the ATR to measure the price movement.
When you see descending Volume bars and descending ATR line (which indicates volatility) this shows
a dis-interest in traders to invest in this pair creating consolidation which creates the chart pattern.
Trade Management after there is a breakout candle close.
1 - Position size (compare volume bar to volume ma line).
a - Breakout candle must be 100% of average volume for a full position size.
b - If 75% of average volume then ½ position size. (To find 75% of Volume
look at the charts volume settings – divide smaller # into larger # = 75%+)
2 - Enter two trades.
3 - SL for both trades will be 1.5 x ATR.
4 - 1st trade TP will be 1 x ATR.
5 - No TP on 2nd trade – letting profit run and adjusting SL to follow price.
6 - When 1st TP hit – move 2nd trade SL to breakeven.
7 - Adjust the 2nd trade SL to follow price.
*8 – After Breakout candle – if price closes back into chart pattern close trade
*9 - When breakout candle is more than 1 ATR from breakout candle open.
a - Enter 1st trade at candle close with ½ position size.
b - Enter 2nd trade with a pending limit order that is 1 ATR of breakout candle open.
c – Price should pullback to that pending limit order for 2nd trade.
d – If Price returns back into chart pattern close trade before SL is hit.

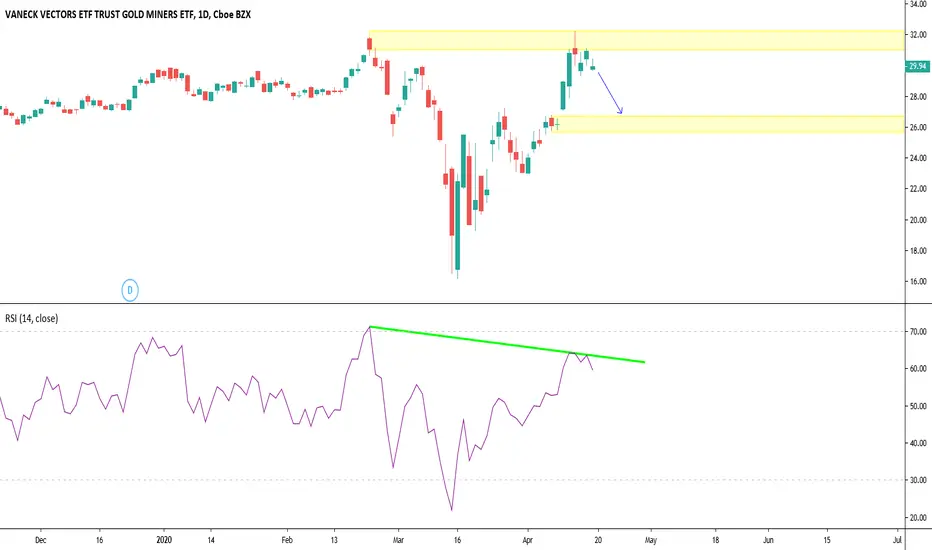
GDX broadening wedge ideathe broadening wedge as well as the overbought rsi lead me to believe we may have reached the top or at least are going to see a bit of a retrace.

GDX - breaking out!GDX at critical juncture. Chase seems like it's on. Looking for some volume to get this ready for the next level.

GDX bearish volume divergence + critical support levelskinda bearish for the short term super bullish mid/long term for gold and gold mining stocks GDX


Two Patterns in GDX "New Bull" Price ActionSince the reversal on the 16th, two dominant chart patterns—symmetrical triangle and continuation channel—have been playing out. I didn't spot the latter until the price action smashed out of the triangle, but there are some notable fibonacci pivots. Price is currently sitting at the crucial .618 level which it has bounced off of at least four times (depending on how you count).
Looking for a further breakout or a retrace on Monday. The bearish divergence in volume makes me think the latter is more likely but sentiment about the Fed's pump and/or a move in the price of gold are strongly in play.
(Novice trader, not advice, feedback welcome, &c.)
