GDX trade ideas


Bear trend in tact (Dow Theory)Expecting $17.00's at this point. GDX looked like it would start a bull pattern earlier this week but failed multiple tests to pass $19.00.


GDX: The Hated Gold Miners Sector is showing some signs of life after completing a long drawn out wave 4 correction following a 6 year impulse down from its 2011 hughs.
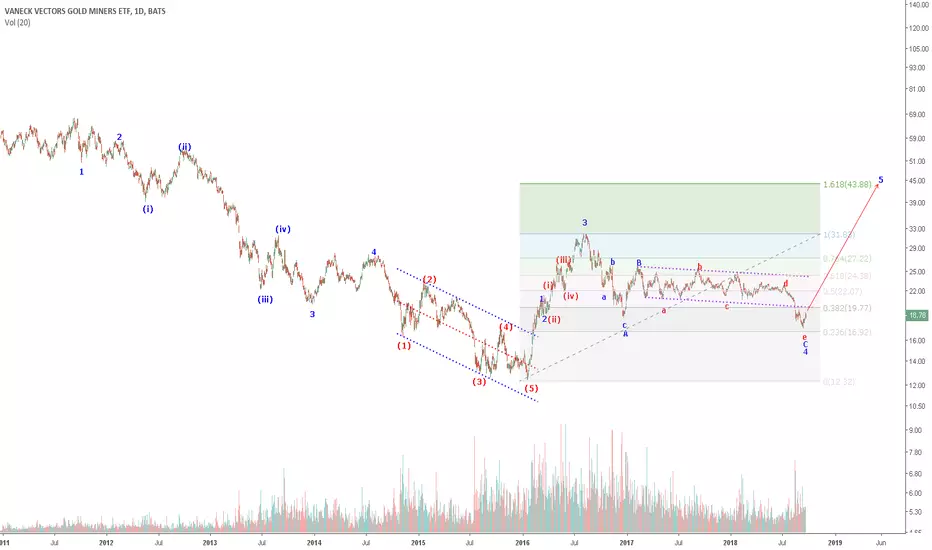
Bearish Cycle Wave in the Gold Miners ETFA double Zig-Zag in the (c) – wave would achieve a measured move equal in length to the (a) – wave.

$GDX oversold on weekly$GDX #GDX is very oversold on the weekly chart and looks bullish to me. I'm already in $NUGT since $12,40 and therefore I'm positive also.
Nothing is sure yet, I know.
I've also placed an order of silver XAGUSD at $13,75
$NUGT
$DUST

GDX is in recoveryAfter Weeks over selling GDX is trying to form a bottom. RSI oversold, bouncing off old resistance (now support), Break of $18.5 will likely lead to recovery up around 21$

GDX good buy in for a flip or a long term accumilationGDX is currently finding support
How to trade it:
- Enter a small position at these levels
If it bounces to 19.20-20.5 sell for a quick flip.
If it drops further double down 17.7-17, downside past this point is unlikely as GDX is already oversold. Sell the bounce after this second buy.
Not financial advise, just educational

Cycle View of Gold Miners ETF: GDXUpdate 9/1/18: Gold (Precious Metals) Miners Sell Off
Fourth Wave corrective bounce continues. Likely PM's are tied to the dollars bounce, and will keep selling off until it tops...

Miners pain not yet over!!! Disclaimer: Personal idea only, not a trading advise!!!
Miners will suffer a bit more until wave 5 has finished.

GDXShort Target 19.25, I think there is a inside bar for that reason i think it is possible Bullish add other tools.

GDX headed to $171) prior support and resistance at $17
2) fibonacci 0.78 level at $17
2) $17 target corresponds to cocordant height of descending triangle breakdown

GDX Broke multi year supportGold miners have taken a hit with metals and broke a multi year support.
I will be looking to enter a short around the kijun.
1. Price below cloud
2. TK cross bear
3. Bearish cloud
3. Lagging span below cloud.


GDX POTENTIALLY TO SET BULLISH GARTLEYIn the weekly chart the movement of the GDX last month continues to decline out of the sideways channel and the triangle pattern is bearish. Although there is a rebound after touching the support at 18.55, bearish pressure is clear as long as the index value is still moving in the formed downtrend channel, or the index value is unable to move up above 22.93 as the previous swing high. A downtred push has the potential to set Bullish Gartley pattern if the GDX value touches to the next support in the 16.62 area, meaning if the pattern has been fulfilled then the last point of the pattern has the potential to be a reversal zone, a failed pattern is formed if the price turns up and exceeds 25.71.

Short $GDX transition to Long $GDX Play$GDX has been the consolidation king for quite some time. Many big players have been gambling on the options of this fella yet the GDX refused to breakdown/up from the consolidation pattern. FINALLY, this fella broke down and this is just the 1st inning of this potential short which we will enter a short after taking profits.

Cycle View of Gold Miners ETF: GDXLooking at the Gold Miners ETF GDX as a potential investment. Seasonally, PM's tend to bottom in July and December, but July didn't work out this year!
So the market is showing what looks like a descending horizontal triangle targeting the point 16.30 which would be a price drop from the end of the triangle equal to the height of the triangle. The implication being that PM's will bottom when the dollar tops in correlation to the USDCNY (the Chinese appear to be putting a floor under the market, buying at a certain support level, but they keep devaluing their currency with respect to the dollar).
Really could see this pattern morphing from a triangle to a running flat, and bottoming in December anyways... time will tell.

Gold miners are rising?...Gold miners are rising? The ETF technical image of GDX Vaneck Vector Gold Minners shows this. GDX's price began to build a rising three-wave wave structure. This equally starts as a correction of a long decreasing trend back. Low D1 ATR decreasing volatility. If the exchange rate is capable of building a full three-wave structure, it can predict a more steady trend turnaround and a longer rise.

OPENING: GDX MARCH/SEPT 18/20 UPWARD PUT DIAGONAL... for a .04/contract credit.
Max Profit on Setup: $4/contract
Max Loss on Setup: $196/contract (width of the spread minus credit received)
Break Even on Setup: 19.96
Delta: 27.37
Theta: .43
Notes: Taking a small bullish shot on gold weakness here with a net credit, calendarized short put vertical. Naturally, I'm not collecting much credit here on fill, but I'll be looking to roll the short put aspect over time to collect additional credit, and look to manage it for a take profit that's at least one-third the width of the spread.

GDX - False breakdownIf it was a true breakdown price should had opened by a gap and drop hard.
This is going to be a false breakdown from the range.
We will be heading to 25 $ soon.
