Bullish on GDXHi .... Guys you want to make money by good bounce ? dont miss this opportunity .....
look at 30 odd number good support to get a bounce from that ...
but consider price could pierce 29 and dont forget aweraging your entry point .....
always chase high probability....
what is in your mind ??
GDX trade ideas

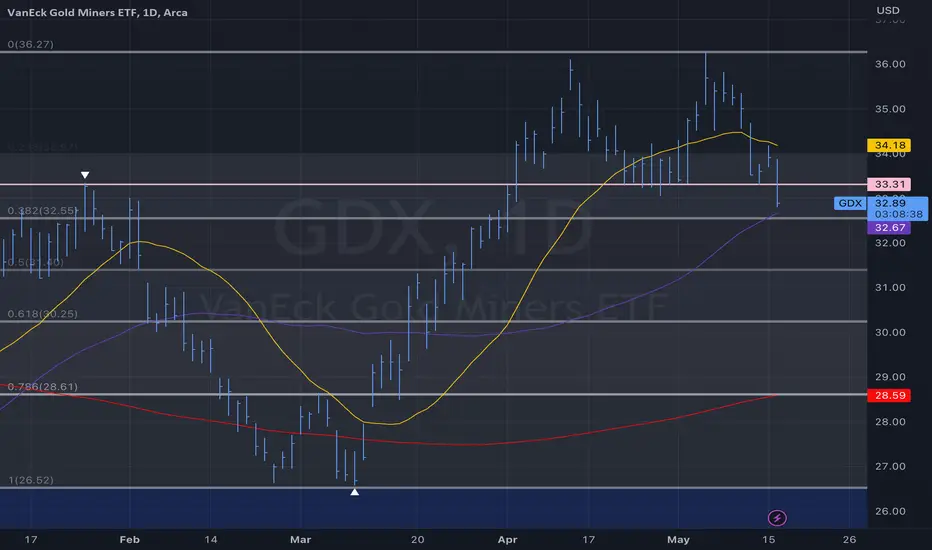
GDX PLAYBULLISH ABOVE 32.24
BEARISH BELOW 31.48
I may take an intraday put position below 32.02
Price is testing weekly 32.24 level if it break and hold I’m looking to go bullish.

$GDX short term support & major supportAMEX:GDX short term support at the 50 day moving average next major support will be around $30
Gold miners long term triangleThis chart pattern has been forming since 2011. It is a triangle merging an uptrend and a downtrend that are potentially converging in the near future.

Raining Gold"When it's raining gold, reach for a bucket, not a thimble."
- Warren Buffet
Hello friends. We think that this is a big opportunity to get bullish exposure to gold miners, and it's good to adjust the sizing according to the edge so we are building a big long position for gold miners.
There are several factors that make this a great time to get long.
For one thing, gold miners are simply priced well. They are trading at a cheap P/E ratio average of 16.6 presently, down by a lot from the bubble highs.
Another factor to consider is seasonality. Gold enters an enormously bullish period in September and then continues to rally through the end of the year with the exception of October.
A big factor that the market isn't even seeming to consider is the fact that gasoline futures have now fallen by around 40%, which is a good sign that inflation has peaked and also means a lower cost basis for the gold produced by gold miners since they use up gasoline and many other commodities within their process of extracting gold. Cheaper gasoline will mean the other commodities used in production can also get cheaper.

Imminent breakout setup in GDXSo many indicators and time frames are bullish GDX right now with bull divergences and montly MacD cross. Classic cup n handle formation with a backtest of cup in progress. Im no EW guru but it looks like we are at the beginning of wave 3. Good RR here with a stop at $31. Let me know what you think of analysis. Cheers.

Elliott Wave Expects Gold Miners ETF (GDX) Buyers expect soonGold Miners ETF (GDX) shows a bullish sequence from 9.26.2022 low favoring further upside. The 100% – 161.8% Fibonacci extension target from 9.26.2022 low comes at 38.3 – 45.7 area. Rally from there is unfolding as a nest where wave ((1)) ended at 33.34 and wave ((2)) pullback ended at 26.64. Wave ((3)) is in progress as another 5 waves in lesser degree. Up from wave ((2)), wave (1) ended at 36.10. Pullback in wave (2) is in progress to correct cycle from 2.24.2023 low in 3, 7, or 11 swing before the rally resumes.
Internal of wave (2) is in progress as a double three Elliott Wave structure. Down from wave (1), wave ((a)) ended at 34.38, wave ((b)) ended at 35.19, and wave ((c)) ended at 34.07. This completed wave W in higher degree. Corrective rally in wave X ended at 35.19. Wave Y lower is in progress as a zigzag structure. Down from wave X, wave ((a)) ended at 33.60, wave ((b)) ended at 34.63, and wave ((c)) of Y should reach the extreme area at 31.9 – 33.15 blue box area. From this area, the ETF can extend higher in wave (3) or rally in 3 waves at least.

Trend Trading Channel Chart GDX Here's a Daily candle Trend Channel Chart of GDX with a Fibb retracement targets for Bull positioning. Bears look for opportunities on counter swing trends back to highs or backtests. Bear trend emerges sub 1900. IMO

Stunning collapse in Gold miners major GDX IndexGDX is now sitting in an intersection of the Bear & Bull Swing Trend Channels put in place from the Pandemic Crash. A tag of the lower rail at around 24 is likely which would take GDX down another 10%-ish. This does not mean a Bottom is in and a new Bull swing will start but it is the first step in starting to track for a potential turn. A complete failure at the Lower Rail would imply a move towards all time lows.

Recession is near ......watch out !!!Read these articles here ,
I am not a scholar to know what the government sleeves are up to but this article spells something is brewing round the corner. If you read some of my articles last year, I did say that I expect the Feds to start lowering the interest rates as unemployment figures will begin to climb higher. So far, the latter has not happened though we witnessed many tech companies reducing their head counts.
Food prices around the world have gone up drastically together with property prices with the exception of your salaries. Think about it , many countries like China, Singapore, South Korea, etc are experiencing aging population with low birth rates. As the workers get into their late 40s , it becomes harder to find a job that pays the same or higher. So, they are stuck in their current job, many are unhappy but for the sake of their mortgages , they have to suck thumb and stay with it.
Then another trend appears - part time and freelance jobs. For those who has little choices, they have to double up to take on extra jobs after their working hours just to make ends meet. From being a tutor to becoming a Grab food delivery rider. We all agreed things back in our grandparents days were much simpler and things definitely costs less. They have fewer wants and needs so even with lower wages, they can get by. We are in a different era now.
Regardless if you think Gold is a productive assets that generate returns or not, it is still in the mind of many (including the Government) to buy gold when recession is forthcoming. When will this change? I don't know. Just be a trend follower and ride the wave out .
Just remember, not to stake all that you have but allocate a fixed percentage (5-10%) of your capital to different assets class. That way, you are insured that at any point in time, the probabilities of a total collapse of all asset classes is reduced. Think harder, if your earned income become lesser, your reserves to set aside for investment should naturally reduce as well. That means, your spread to different asset class also reduced.
So, finding other sources of income become even more crucial in times of recession coz nobody knows for sure when you are going to be replaced.

Portfolio Selected Visuals (PSV) April 2023From the portfolio selection on 5 April 2023...
XLK has broken out and moved;
GDX just broke out;
EWS (Singapore ETF) is just breaking out;
XLE (Energy) just rebounded to find its footing back in the channel.
INDY or GXC or ILF maybe next?

Gold Miners ETF (GDX) Develops Elliott Wave Bullish SequenceGold Miners ETF (GDX) is close to breaking above the previous peak on 1.25.2023 high (33.34). A break above will open up a bullish sequence from 9.26.2022 low favoring further upside. Near term, cycle from 3.10.2023 low is in progress as a 5 waves impulse Elliott Wave structure. Up from 3.10.2023 low, wave 1 ended at 29.95 and pullback in wave 2 ended at 28.50.
Wave 3 is currently ongoing with internal subdivision as another 5 waves in lesser degree. Up from wave 2, wave ((i)) ended at 31.99 and pullback in wave ((ii)) ended at 29.63. We can see wave ((i)) and ((ii)) in the 45 minutes chart below. The ETF then extends higher in wave ((iii)). Up from wave ((ii)), wave (i) ended at 31.80 and wave (ii) ended at 30.74. Wave (iii) ended at 32.80 and pullback in wave (iv) ended at 31.95. Final leg wave (v) of ((iii)) is expected to end soon, then it should pullback in wave ((iv)) before turning higher again in wave ((v)) to complete wave 3. Near term, as far as pivot at 29.63 low stays intact, expect dips to find support in 3, 7, or 11 swing for further upside.

GDX: Gardening 🌱🌷🌹It’s springtime and GDX is working on wave B in green in its green garden between $30.01 and $32.58. Soon the ETF should harvest the respective high, which could be settled anytime. Afterward, the course should turn and leave the garden on the southern side to expand wave ii in orange. This downwards movement should end well before the support at $21.52, though, so that GDX can resume the ascent. However, there is a 38% chance that the ETF could slip below this mark and thus continue the descent instead.

Trade Idea: GDXTrue Bull markets in Gold are led by the miners, as spec money bids the sector and industry higher.
We know that Gold has outperformed and had magnificent strength to the upside however its counterparty GDX has lagged.
Seeing relative strength in Gold & relative weakness really emphasizes what were going through... a Liquidity crisis.
Gold is moving on fear and miners are lagging.
If gold softens up just a bit GDX will see a greater move to the downside.

$GDX: Next Target $38.41This is not financial advice.
I believe $GDX will make a run up to at least $38.41, and potentially higher.
The measured move is confirmed by long hand as well as Fib. extension:
1. High of $33.34 minus it's low of $21.52 (Point A) = $11.82. Point B's (retracement) low of $26.59 + $11.82 = $38.41.
2. Drawing the Fib. extension as show on the chart confirms the same price target.

GDX - A Tale of Two RoadsA path is never in a straight line, but trends do tend to remain until broken. GDX's trend has been mostly down since its rise into the glistening lights offered around $66 just over a decade ago. Many have rode beside this golden hue over the past decade and wondered if it will ever reclaim its once radiant luster... the truth is no one really knows, but using the past as a precursor one can glimmer an ounce of perception in the hopes it will unfold in that direction. I present two roads for GDX to follow... neither will be exact (especially in time), but one could offer some respite for the wary traveler that has so faithfully remained by this golden hue's side. Candles will be our North Star for this journey, and currently the 3 month candle is a doji - if this star becomes a shooting one, then the bearish odds will intensify, if this star becomes a continuation/green candle (closing in the small rectangle), then the bullish odds will resume for at least a few more months. The Monthly candle has engulfed most of the bullish momo, and if a monthly candle closes below the danger zone, then the 1:2, 1:2 bullish set up (yellow path) is likely negated. The Elliot Observer would like to offer food for thought, 5 waves down is always followed by another 5 waves down... this should hold true even if GDX has never been impulsive. GLTA!

GDX Technical Support Outlined...Here we are looking at GDX on the Daily TF…
This analysis will be fairly brief, as the chart is crystal clear as of right now. Here you can see that GDX has retraced since its most recent uptrend which began in November of 2022. Currently, I am expect GDX to bounce off of the strong technical support as marked by the horizontal line (yellow).
This outlined support line hasn’t been re-tested since its break out from it (as previous resistance) which led to its run up as previously mentioned. Now, we can expect GDX to attempt to bounce from this line, and turn this previous resistance into newfound support.
It’s as simple as that…
Let me know what you think BTC is going to do next in the comments!
Cheers!!


#gdx #gdxj Anchored vwap + 200dma to support next leg of rally?Keep an eye on GDX and GDXJ, the two most popular gold mining ETF's. We have a confluence of the anchored vwap from the April 2022 highs meeting the 200dma. If history repeats we could start to see gold miners gather a bid here for the next move higher.
Gold price is holding up at the 38.2% fib + yearly pivot, so im watching closely for another rally at these levels of interest.

Good BreakdownI wont trade this but its a good setup. Gold can be gappy and I really dont like those.
Ill watch it to see how it plays out

Gdx major uptrend Gdx has been in a major uptrend since 2015
We haven’t seen any hype for sometime (2011)
The majority have declared the sector ded
On the move from the 2020 highs I see 5 pivots down
I also see bull and bear traps
Things look poised
If gold ain’t done this will send
GRI 2023
NOT TARDING ADVICE

Gdx big picture The green channel is our bulltrend from the cycle low in 2015
The yellow is our balance off recent major pivots
I think the major low is in late last year and we are looking to set a high, most likely a higher high- this year
GRI 2023
