GLD trade ideas


Over Bought Gold Near Major ResistanceGold and the Gold ETF - GLD both have weekly RSI readings that are the most over bought since the all - time high.
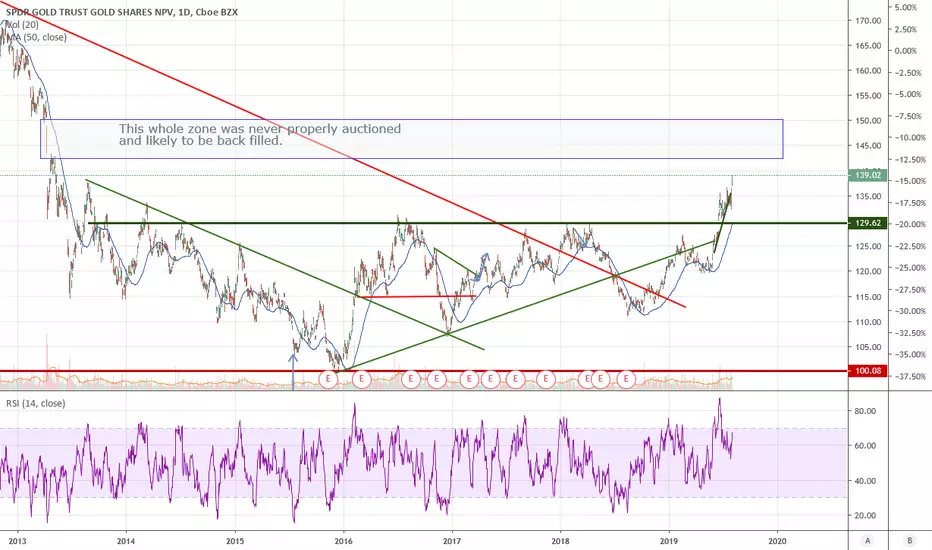
GLD is close to a 50% retrace of the bear market from the all -time high at 143.04
The wave (B) of a probable "A-B-C" rally appears to be an Elliott wave - Horizontal Triangle.
After conclusion of an H Triangle there's usually a post triangle trust - which has happened. The trust is measured by the widest part of the triangle.
Wave "A" = 23.86 + termination point of wave "E" 119.54 + 23.86 = 143.40.
If there's a peak in the resistance zone the subsequent decline could go at least back the bear market bottom of 100.23.
Mark

$gld is not done yet. Inventory gap needs filled aboveWill likely reauction the 145-150 zone since it wasn't done on the drop.
GLD (SPDR Gold Trust) Technical AnalysisWhile stock market investors have been chasing the market rally this year, central banks and hedge funds have been quietly buying up Gold over the last half a century. Major hedge funds including Bridge Water Associates founded by Billionaire Investor Ray Dalio have increased it's holdings in SPDR Gold Trust in the second half of 2018.
The long term trend in Gold remains in tact and SPDR Gold Trust remains above its 50-Day and 200-Day MA. The feds recent comments and disappointment to the markets on a 25bp rate cut show a growing trust in the metals value going forward.

GLDI'M in a couple of puts here... I would think with the fed rate cut this would come back down some. Thoughts?


$GLD could revisit 130Good day folks,
Based on RSI and VI, I think GLD could retest its 130 support. However, the chart being in 4 hr Renko Bars, this could take a "few weeks" to materialize. I remain very bullish on the long term, so this is just a pullback imo.
Thank you,

If Minor Wave (B) Complete, (C) Will Equal (A) at $595 Cash SpotGold topped August 2011 completing an intermediate level 5 way advance ending at 1,923. It has been correcting ever since in intermediate (Green) (A)(B)(C) with (A) in 5 minor waves and (B) in 3 minor waves (with red B as a running triangle which I believe was followed by a quick thrust C that just finished at yesterday's high of $1,454).
Minor wave (B), where red A equals red C at $1,345 (134.5 in GLD), is just shy of a 50% retracement of minor wave (A). So its a good stopping point.
The price range of (C) should most likely equal the price change of (A). That would give the next minor 5 wave segment, (C), a price target of $595 in the cash market or $59.5 for GLD.
This may be my last free published analysis. If you are interested in learning about my paid subscription, ping me here with an email address where I can reach you.
Good luck!

Double triangle breakoutA larger descending triangle breakout along with a smaller ascending triangle breakout

erm... buy that damn dipdip due to a short term spike in DXY. but with fed cuts coming will help usd sell off. will it be a .25 or a .50 bps? to be continued

GDL - Wedge formation Long setup Gold itself is setting up as flag with potential target of 1520 with weekly chart showing a wedge and target of 1610.
GLD (NEW) - Another way to play the move on gold. Possible entry if gold breaks 1431 or break of 135 on GLD. Stop signal 130.43, Target 145.83. Could Consider October 137 calls currently 3.13.


