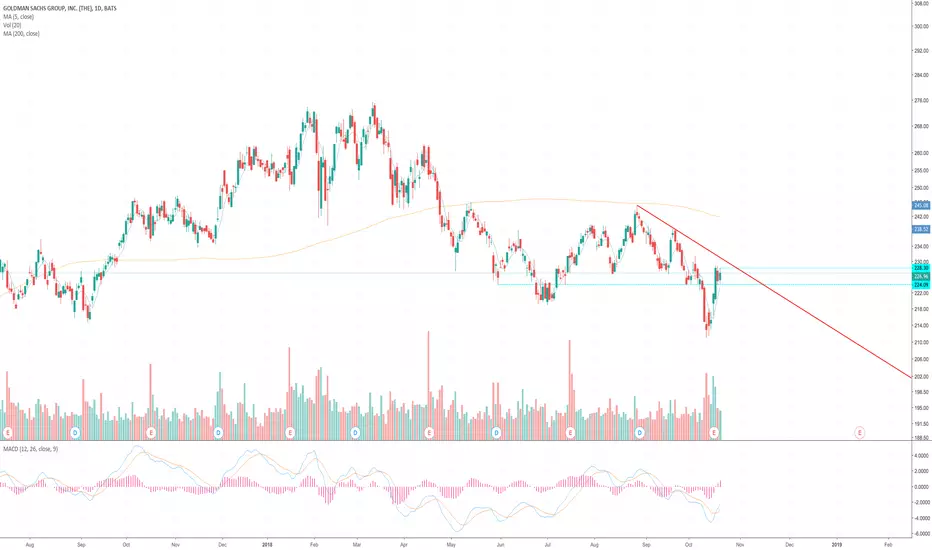
Head and Shoulders on GS stock - 1w chartNoticed a head and shoulders pattern on Goldman Sachs stock. Might see it rebound and test of the green line at $230 price level, but this pattern indicates to stay on the sell side.
Keeping an eye on Fibonacci retracement levels too.
GS trade ideas

GS Long OpportunityFound channel support coinciding with the retrace level and previous support . Good for long entry and Exit would be at at the upper channel
Exit the trade if price closes below the support line.

$GS BULLISH SETUP GS WITH THE INSIDE DAY AT PREVIOUS MARKET STRUCTURE
HRLY CHART COILED TIGHT
EYEING FOR LONG ENTRY MONDAY IF MARKET OBLIGES

$GS SUPPORT AND 5MA CURLING UPSHORT TERM SENTIMENT IN FINANCIALS CHANGING
STALKING QUICK TRADE IN GS
HOLDING BAC CALLS FROM LAST WEEK AS WELL


Goldman Sachs head and shoulders on monthly about to play outH&S about to break down, target is to support line around $200

38.2% & POSSIBLE 61.8% Retracement SHORT GWAVE.38.2% & POSSIBLE 61.8% Retracement SHORT GWAVE.
FIB Retracement Percentage is calculated in a Higher Euclidean Dimension.
PLEASE ALWAYS WAIT FOR STOCHASTIC CONFIRMATION!!! THANKS
Goldman Sachs Head and shoulders shortpretty much an easy short til about 218 a breach and close of that level will take us down another 8 bucks or so
i normally dont trade head and shoulders but this pattern stuck out a mile away


$GS - Down 20%-30% over next 8 months. So this is really about it be it, lol. For anyone that can argue this - feel free. Fortunately, not all financials are AS bad as $GS looks, but they don't necessarily look great either (technicals, at least). I've been MORE than bearish on financials for some time now, but really $GS is what I've been focused on because the underperformance is just unbelievable. To make it easy, this is the epitome of how I determine a volatile ass correction vs. the start of a real bear market. 2015 - 2016 wasn't a bear market, but solid ass corrections. $BMA for example (2nd largest private bank in Argentina), at this very moment is @ the point it starts a true bear market, or the start of a correction. Old (June 6th) pic - New pic - Back towards end of July, I noticed $PFG (Iowa based insurance company) - Was around April 2018 the performance of insurance groups & (most) banks started to fall off a cliff in regards to performance - think Fed raised rates sometime around end of March, but within a month & a half even $AIG is down -25% since February. Something is obviously going on - not sure how much Turkey or Argentina or even housing would have to do with it, but like I said if you have an argument - I'm all ears.
You can look @ it on chart, but just in case nobody does that off rip, I'll make it even easier.
$PFG 2008 -
$PFG 2009 -
$PFG 2018 -
$PFG - 20?? -

Goldman Sachs: Most signs are pointing up This will be a short post because there is a lot of verbiage in the chart. Generally while I definitely see a few bearish signs in Goldmans chart most are relatively bullish. Keep in mind these are weekly candlesticks used to project what may happen in several weeks or potentially months time so don't infer anything about day to day movements from this analysis. Questions and criticisms welcome, thanks.

38.2% & POSSIBLE 61.8% Retracement LONG GWAVE38.2% & POSSIBLE 61.8% Retracement LONG GWAVE.
FIB Retracement Percentage is calculated in a Higher Euclidean Dimension.
PLEASE ALWAYS WAIT FOR STOCHASTIC CONFIRMATION!!! THANKS


Resistance for GoldmanThere is resistance right above here for $GS. I would consider it positive if we consolidate right here before trying to break through it again. If it makes it through, looking at $255-260 imo.

GS Long SetupPrevious resistance acting as support and closed above 100 EMA . Target 244
XLF telling a different story. Stay cautious.

GS -- something to watchWhen I look closely at GS, I can't help but get a nagging feeling that we aren't done with downside yet. In my earlier notes, I expressed my desire to buy at the 212-208 region, and when I re-work my calculations, that precisely what I still want to see.
Earlier this week, I mentioned that GS was approaching supports. I am currently of the opinion that the supports will NOT hold, and instead we will slice into the 212 regions by end of August

Possible Inverse H&S Pattern Play with $GSThis trade offers a good reward to risk.
Stop $232.75
Trigger >$240
Target $260

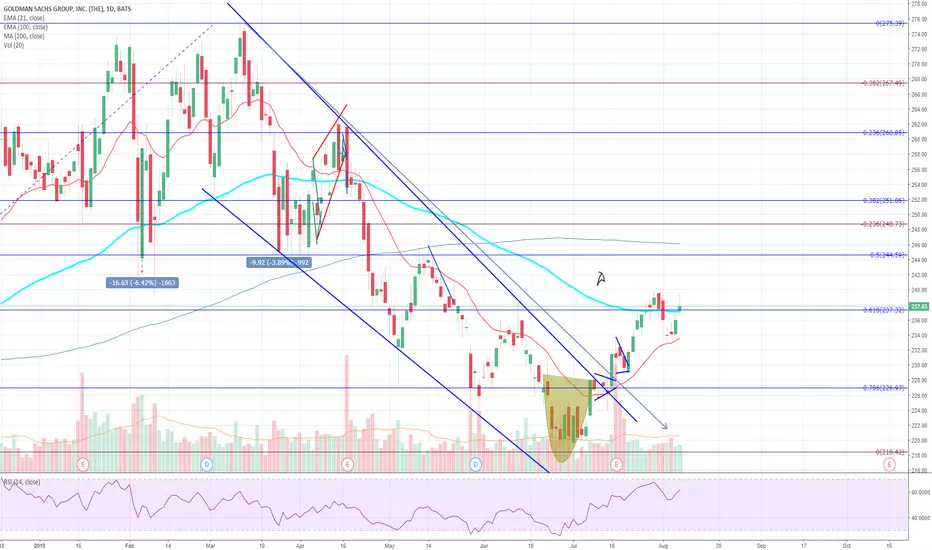
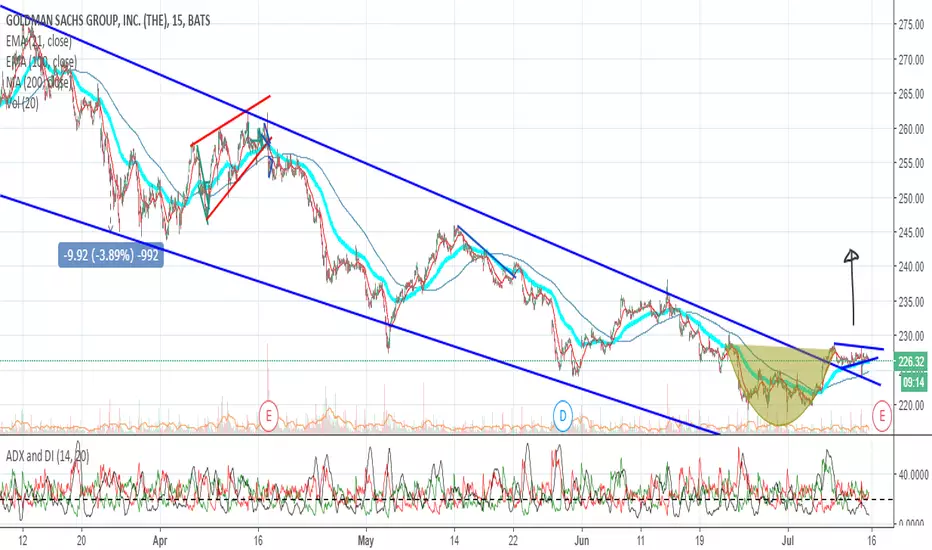
GS Cup and Handle Breakout Coming into Play GS Broke out of the longer term descending channel and consolidating for a breakout
GS - approaching supportsI think we might get an opportunity to buy GS sometime next week, if it goes to either of the lower two yellow lines. Expect a 1:1 measure move target in the 250s
