Opening (IRA): IBIT July 18th 51 Short Put... for a .59 credit.
Comments: One of the higher IV ETF's on my board at the moment. A starter position, targeting the strike paying around 1% of the strike price in credit.
Will look to ladder out at intervals ... .
Key stats
About ISHARES BITCOIN TRUST ETF
Home page
Inception date
Jan 5, 2024
Structure
Grantor Trust
Replication method
Physical
Dividend treatment
Capitalizes
Distribution tax treatment
Ordinary income
Income tax type
Capital Gains
Max ST capital gains rate
39.60%
Max LT capital gains rate
39.60%
Primary advisor
BlackRock Fund Advisors
IBIT aims to track the spot price of Bitcoin, less expenses and liabilities. It intends to provide accessibility to Bitcoin without the complexities of acquiring, holding, and trading directly through a digital asset platform. The trust is backed by Bitcoin held in cold storage, which is a safeguarding method by which the private keys corresponding to the trusts Bitcoins are generated and stored in an offline manner, making them more resistant to hacking. Holdings are valued daily based on the CF Benchmarks Index. This serves as a once-a-day benchmark rate of Bitcoins USD price, calculated as of 4:00 pm ET. The index aggregates the trade flow of several Bitcoin platforms during an observation window, focusing on relevant transactions, as defined by the index provider. At the time of launch, the Issuer waived a portion of the fee. The funds expense ratio and tracking should be reviewed and considered for comparison purposes.
Related funds
Classification
Symbol
Geography
Global

BTC - Channel is Broken, Now What?
The most bullish scenario right now is that the price stays in the upper part of the channel, tests the top of the channel and continues to rise.
If this breakout in BTC remains a manipulation, the price may also make the same manipulation downwards. When the price breaks through, my first thou

$IBIT a BITCOIN ETF Is Breaking Out of a Flat BaseNASDAQ:IBIT I have been looking at this for quite awhile now. I drew in an “area” of resistance, and it has hit that twice in the last few days. I bought a position on Jul 3rd and was stopped out. It just broke again so I have opened yet another position and will use a stop on a close below the 21
$IBIT: ETF can turn bullish in the weekly this week......if all goes well, and the daily trend works nicely (maybe hitting target #2 this week if news favor us in the coming days and gap fading a$$holes don't kill the trend if we get a 4th of July gap up), Bitcoin will start to trend up strongly.
The monthly timeframe is already bullish as of June's c

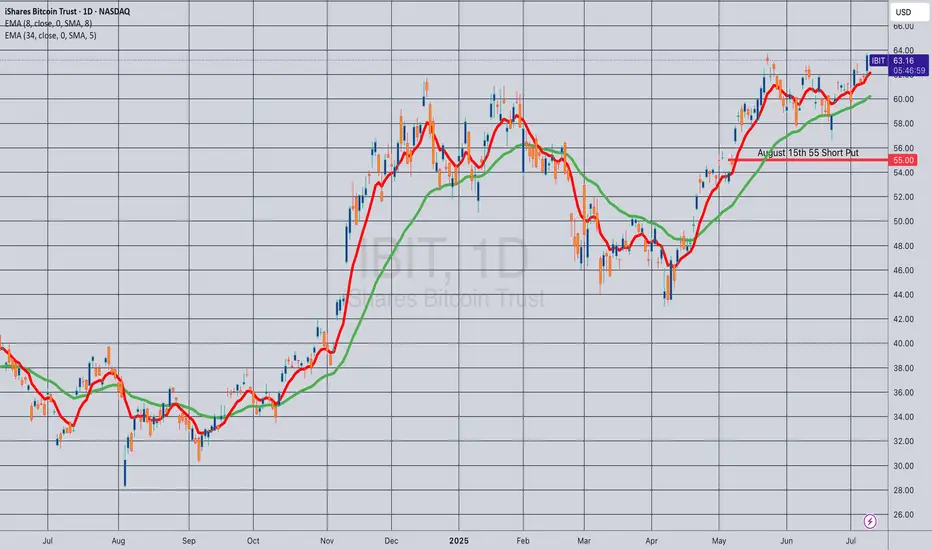
Opening (IRA): IBIT August 15th 55 Short Put... for a .62 credit.
Comments: One of the higher IV ETF's on my board. Targeting the strike paying around 1% of the strike price in credit.
IBIT - Trying to Confirm Upside BreakIf you are wanting BTC to breakout this is a very important chart. There is a chance IBIT is frontrunning the BTC breakout.
For the past 45 days IBIT has been forming some sort of parallel channel breakout with the top trendline being our orange trendline. We have had many touchpoints of resistanc

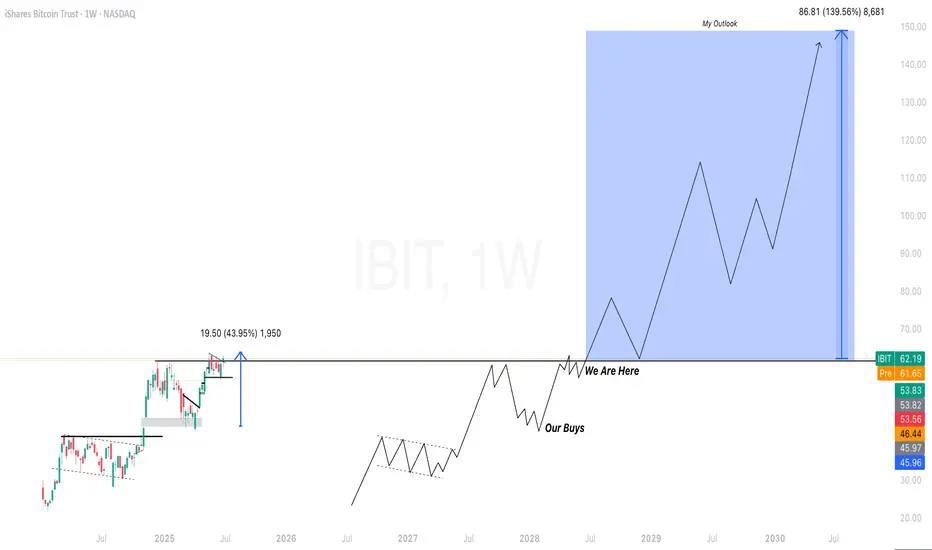
$IBIT Long Term Outlook BTC has tons of room for upside and I see the same for IBIT in the next 5 years 📈. Incredibly high conviction!
IBIT: End of June/Beginning of July Weekly idea for IBIT.
BTC and this market as a whole is an interesting character.
The indicies and many other things, such as BTC, AMD etc. are all throwing top signals, specifically mean reverting signals (when using Pairs / Cointegration and Time series).
They have been for the last 1.5 weeks.

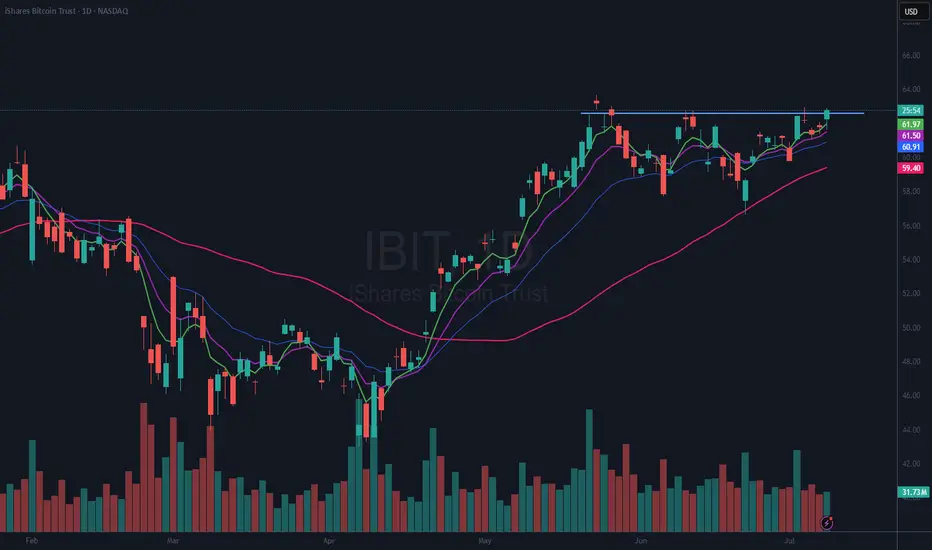
IBIT – Bull Flag + Trend-Based Fib Targets Lined Up🔍 Price Action Setup
IBIT is forming a tight bull flag just beneath key resistance at $64 after a strong impulsive move off the $42.75 base. Structure remains bullish with price holding above the 20 EMA, and volume compression setting the stage for a breakout.
📈 Trend-Based Fibonacci Extensions
If

Opening (IRA): IBIT July 25th 48 Short Put... for a .48 credit.
Comments: The highest 30-day IV on my ETF board (aside from USO and UNG). Laddering out, targeting the strike paying around 1% of the strike price in credit.

See all ideas
Summarizing what the indicators are suggesting.
Oscillators
Neutral
SellBuy
Strong sellStrong buy
Strong sellSellNeutralBuyStrong buy
Oscillators
Neutral
SellBuy
Strong sellStrong buy
Strong sellSellNeutralBuyStrong buy
Summary
Neutral
SellBuy
Strong sellStrong buy
Strong sellSellNeutralBuyStrong buy
Summary
Neutral
SellBuy
Strong sellStrong buy
Strong sellSellNeutralBuyStrong buy
Summary
Neutral
SellBuy
Strong sellStrong buy
Strong sellSellNeutralBuyStrong buy
Moving Averages
Neutral
SellBuy
Strong sellStrong buy
Strong sellSellNeutralBuyStrong buy
Moving Averages
Neutral
SellBuy
Strong sellStrong buy
Strong sellSellNeutralBuyStrong buy
Displays a symbol's price movements over previous years to identify recurring trends.
Curated watchlists where IBIT is featured.

Bitcoin ETFs: Spot trading hits Wall Street
11 No. of Symbols
See all sparks
Frequently Asked Questions
An exchange-traded fund (ETF) is a collection of assets (stocks, bonds, commodities, etc.) that track an underlying index and can be bought on an exchange like individual stocks.
IBIT trades at 67.60 USD today, its price has fallen −0.43% in the past 24 hours. Track more dynamics on IBIT price chart.
IBIT net asset value is 67.72 today — it's risen 13.58% over the past month. NAV represents the total value of the fund's assets less liabilities and serves as a gauge of the fund's performance.
IBIT assets under management is 84.16 B USD. AUM is an important metric as it reflects the fund's size and can serve as a gauge of how successful the fund is in attracting investors, which, in its turn, can influence decision-making.
IBIT price has risen by 13.78% over the last month, and its yearly performance shows a 86.23% increase. See more dynamics on IBIT price chart.
NAV returns, another gauge of an ETF dynamics, have risen by 13.58% over the last month, showed a 41.73% increase in three-month performance and has increased by 27.07% in a year.
NAV returns, another gauge of an ETF dynamics, have risen by 13.58% over the last month, showed a 41.73% increase in three-month performance and has increased by 27.07% in a year.
IBIT fund flows account for 131.54 B USD (1 year). Many traders use this metric to get insight into investors' sentiment and evaluate whether it's time to buy or sell the fund.
Since ETFs work like an individual stock, they can be bought and sold on exchanges (e.g. NASDAQ, NYSE, EURONEXT). As it happens with stocks, you need to select a brokerage to access trading. Explore our list of available brokers to find the one to help execute your strategies. Don't forget to do your research before getting to trading. Explore ETFs metrics in our ETF screener to find a reliable opportunity.
IBIT expense ratio is 0.25%. It's an important metric for helping traders understand the fund's operating costs relative to assets and how expensive it would be to hold the fund.
No, IBIT isn't leveraged, meaning it doesn't use borrowings or financial derivatives to magnify the performance of the underlying assets or index it follows.
In some ways, ETFs are safe investments, but in a broader sense, they're not safer than any other asset, so it's crucial to analyze a fund before investing. But if your research gives a vague answer, you can always refer to technical analysis.
Today, IBIT technical analysis shows the buy rating and its 1-week rating is buy. Since market conditions are prone to changes, it's worth looking a bit further into the future — according to the 1-month rating IBIT shows the strong buy signal. See more of IBIT technicals for a more comprehensive analysis.
Today, IBIT technical analysis shows the buy rating and its 1-week rating is buy. Since market conditions are prone to changes, it's worth looking a bit further into the future — according to the 1-month rating IBIT shows the strong buy signal. See more of IBIT technicals for a more comprehensive analysis.
No, IBIT doesn't pay dividends to its holders.
IBIT trades at a premium (0.40%).
Premium/discount to NAV expresses the difference between the ETF’s price and its NAV value. A positive percentage indicates a premium, meaning the ETF trades at a higher price than the calculated NAV. Conversely, a negative percentage indicates a discount, suggesting the ETF trades at a lower price than NAV.
Premium/discount to NAV expresses the difference between the ETF’s price and its NAV value. A positive percentage indicates a premium, meaning the ETF trades at a higher price than the calculated NAV. Conversely, a negative percentage indicates a discount, suggesting the ETF trades at a lower price than NAV.
IBIT shares are issued by BlackRock, Inc.
IBIT follows the CME CF Bitcoin Reference Rate - New York Variant - Benchmark Price Return. ETFs usually track some benchmark seeking to replicate its performance and guide asset selection and objectives.
The fund started trading on Jan 5, 2024.
The fund's management style is passive, meaning it's aiming to replicate the performance of the underlying index by holding assets in the same proportions as the index. The goal is to match the index's returns.