IEMG - another powerful move to the top of the channel??This ETF has been moving. Looks like it has room to run.
Key stats
About ISHARES INC
Home page
Inception date
Oct 18, 2012
Structure
Open-Ended Fund
Dividend treatment
Distributes
Distribution tax treatment
Qualified dividends
Income tax type
Capital Gains
Max ST capital gains rate
39.60%
Max LT capital gains rate
20.00%
Primary advisor
BlackRock Fund Advisors
Distributor
BlackRock Investments LLC
IEMG offers outstanding coverage of emerging markets. As part of the line of 'Core' ETFs from BlackRock, it offers very similar but more comprehensive exposure than its sister fund EEM by including smaller firms in the portfolio. IEMG follows the same MSCI index as our benchmark and so it counts South Korea as an emerging market, in contrast to FTSE-based funds such as VWO. The fund does not fully replicate the underlying index, yet uses a representative sampling. A strategy commonly used in order to reach or exclude securities for preferred investing or trading purposes. Over time the fund manager expects tracking err to be less than 5%. Also a common practice worth noting, the fund uses a subsidiary located in the Republic of Mauritius to invest portion of the portfolio in India.
Classification
What's in the fund
Exposure type
Finance
Electronic Technology
Stock breakdown by region
Top 10 holdings

Emerging marketsThe National Stock Exchange of India has experienced the best year as investors ripped big as their stock market pushed higher, outperforming major global indices. Other emerging markets have been on investors' radar as they look for other markets to invest in.
The iShares Emerging Market ETF experi

IEMG Emerging markets Bull flagThere is a bull flag forming on IEMG. I am waiting for a test of the 0.382 fib which also lines up with previous support.

IEMG ETF Retest of level 48.89Idea:
SL < 48.81
BUY < 49.57
Fundamental:
- Pro: NAV is big enough
- Pro: IShares ETF is liquid enough

IEMG Emerging Mkt: bottom is in; see TP for waves 3 & 5IEMG made a bulltrap with a long hammer in this monthly chart. RSI oversold.
It went back inside the pitchfork upchannel.Wave 1 of 3 has bottomed out.
The target price for wave 3 is 90 (FIBO Ext), a 55% profit from the 58 price.
Final wave 5 target projected at 1.618 FIBO is around 111.
Not trading

Emerging Mkt ETF: BULLFLAG will make a 55% run from current 58IEMG has very high probability of reversing due to the recent formation of a diamond pattern.
Some more downside move to the base of pitchfork is still possible but unlikely due to the BULLFLAG formation. Also smart money has already been accumulating with increasing volume during this flag consolid

Trends in select Emerging Markets (& smaller markets) via ETFsRecent trends in select Emerging Markets (and some smaller markets) viewed by their ETFs, for the countries: Brazil EWZ , Mexico EWW , New Zealand ENZL , South Korea EWY , China MCHI , India INDA - also vs. the emerging markets ETF IEMG , and the NASDAQ IXIC index.


iShares Core MSCI Emerging Markets ETFCost: $ 52.27
Annual trading range: $ 35.66-55.45;
Dividend Yield: 3.51%;
Wealth Management Cost: 0.13% per year (i.e. $ 13 for every $ 10,000).
iShares Core MSCI Emerging Markets (NYSE: EEM) ETF (NYSE: IEMG) invests in 2,476 large, medium and small companies. The five largest sectors are represent

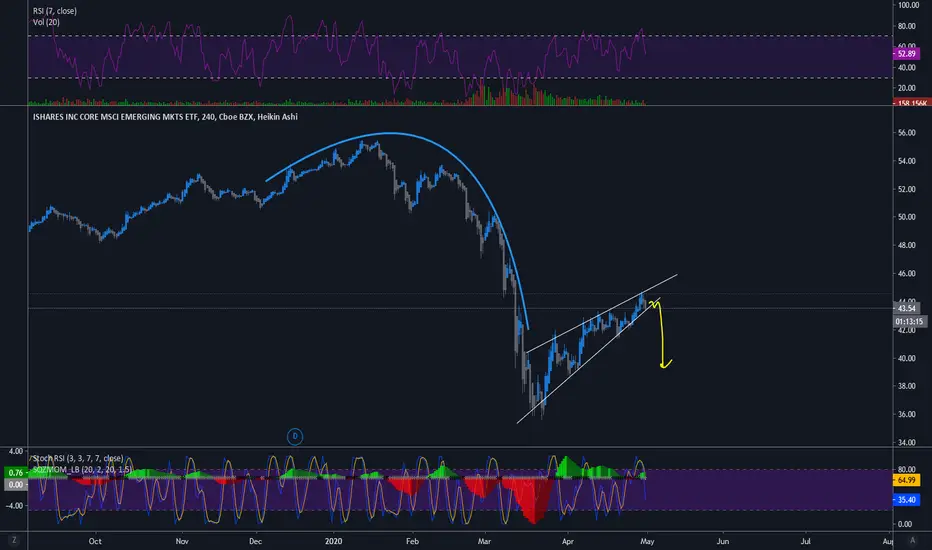
IEMG Ascending WedgeForming a wedge since the local bottom in March. I would expect it to break down further.
See all ideas
Displays a symbol's price movements over previous years to identify recurring trends.
Related funds
Frequently Asked Questions
An exchange-traded fund (ETF) is a collection of assets (stocks, bonds, commodities, etc.) that track an underlying index and can be bought on an exchange like individual stocks.
IEMG trades at 57.25 USD today, its price has risen 4.24% in the past 24 hours. Track more dynamics on IEMG price chart.
IEMG net asset value is 57.18 today — it's risen 10.56% over the past month. NAV represents the total value of the fund's assets less liabilities and serves as a gauge of the fund's performance.
IEMG assets under management is 88.28 B USD. AUM is an important metric as it reflects the fund's size and can serve as a gauge of how successful the fund is in attracting investors, which, in its turn, can influence decision-making.
IEMG price has risen by 4.24% over the last month, and its yearly performance shows a 4.24% increase. See more dynamics on IEMG price chart.
NAV returns, another gauge of an ETF dynamics, have risen by 10.56% over the last month, showed a 5.75% increase in three-month performance and has increased by 10.62% in a year.
NAV returns, another gauge of an ETF dynamics, have risen by 10.56% over the last month, showed a 5.75% increase in three-month performance and has increased by 10.62% in a year.
Since ETFs work like an individual stock, they can be bought and sold on exchanges (e.g. NASDAQ, NYSE, EURONEXT). As it happens with stocks, you need to select a brokerage to access trading. Explore our list of available brokers to find the one to help execute your strategies. Don't forget to do your research before getting to trading. Explore ETFs metrics in our ETF screener to find a reliable opportunity.
IEMG invests in stocks. See more details in our Analysis section.
IEMG expense ratio is 0.09%. It's an important metric for helping traders understand the fund's operating costs relative to assets and how expensive it would be to hold the fund.
No, IEMG isn't leveraged, meaning it doesn't use borrowings or financial derivatives to magnify the performance of the underlying assets or index it follows.
Yes, IEMG pays dividends to its holders with the dividend yield of 2.92%.
IEMG trades at a premium (0.41%).
Premium/discount to NAV expresses the difference between the ETF’s price and its NAV value. A positive percentage indicates a premium, meaning the ETF trades at a higher price than the calculated NAV. Conversely, a negative percentage indicates a discount, suggesting the ETF trades at a lower price than NAV.
Premium/discount to NAV expresses the difference between the ETF’s price and its NAV value. A positive percentage indicates a premium, meaning the ETF trades at a higher price than the calculated NAV. Conversely, a negative percentage indicates a discount, suggesting the ETF trades at a lower price than NAV.
IEMG shares are issued by BlackRock, Inc.
IEMG follows the MSCI EM (Emerging Markets) IMI. ETFs usually track some benchmark seeking to replicate its performance and guide asset selection and objectives.
The fund started trading on Oct 18, 2012.
The fund's management style is passive, meaning it's aiming to replicate the performance of the underlying index by holding assets in the same proportions as the index. The goal is to match the index's returns.