IWM trade ideas

IWM INVERSE HEAD & SHOULDERS CONTINUATONHere is IWM bouncing off of the 5ema while also in the process of confirming an Daily inverse head and shoulders pattern. The inverse head and shoulders will be confirmed once price breaks 199.53 and this could give IWM a chance for continuation to $205+.

IWM BreakoutIWM brokeout on friday. Pull backs = BTFD. MACD and RSI curling. Small caps have been heating up and the run starts now. Lots of room for upside in sentiment and oscillators. RISK ON.

$IWM pump and dump?AMEX:IWM bulls need to step up if we want to get it back to $205 level and continue on upward if not we'll fall back to $196 then later eventually leading back to lows 160s. NASDAQ:NVDA earnings will factor along with CPI / OPEX ahead.


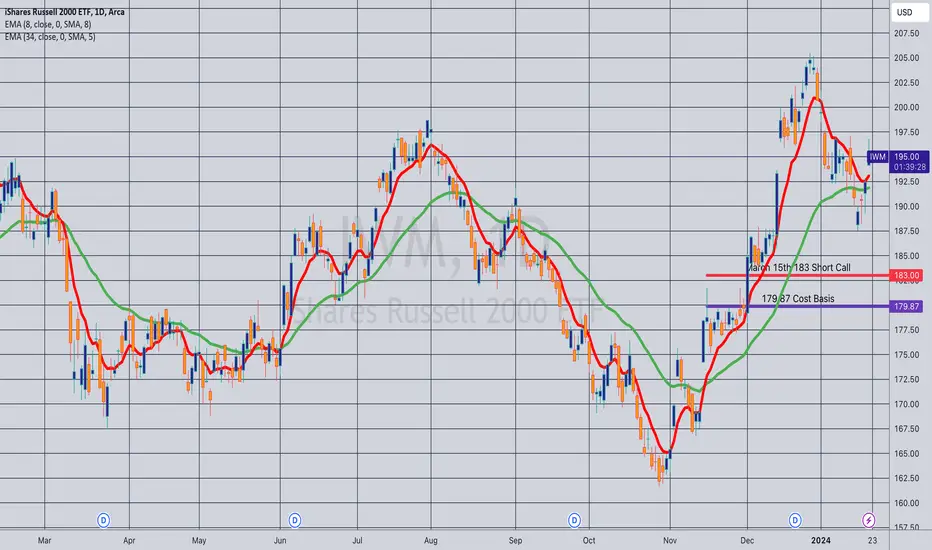
Opening (IRA): IWM March 15th 183 Monied Covered Call... for a 179.87 debit.
Comments: Doing another one of these in March with a short call strike and cost basis better than what I currently have on at the 186.
Selling the -75 delta call, buying a Johnny one lot to emulate a 25 delta short put in order to take advantage of call side IV skew.
3.13 max profit on BPE of 179.87; 1.74% ROC at max; .87% at 50% max.
Will generally look to take profit at 50% max/roll out the short call to reduce cost basis further in the event price breaks the short call.
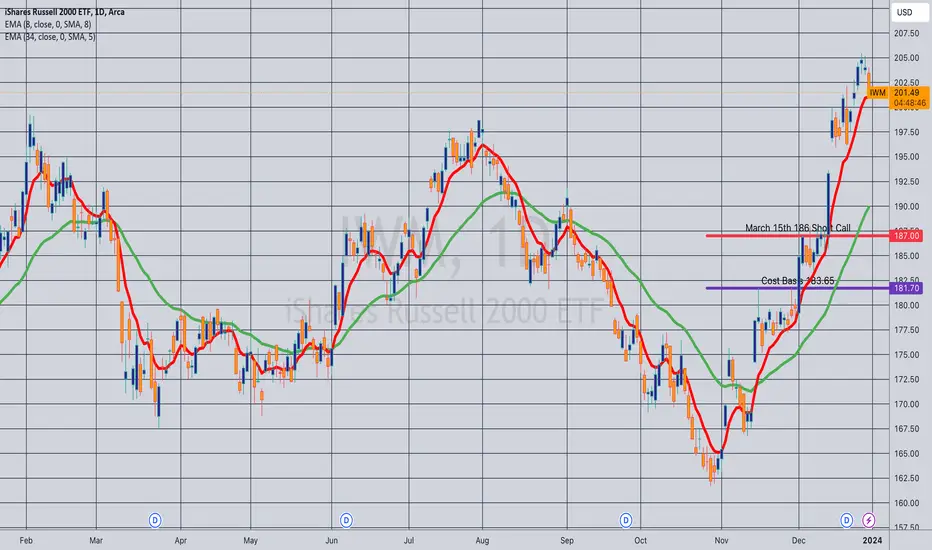
Opening (IRA): IWM March 15th 186 Monied Covered Call... for a 181.70 debit.
Comments: Buying stock and selling the -75 call again to emulate a 25 delta short put that is "defense ready" via roll of the short call.
4.30 ($430) max on buying power effect of 181.70; 2.37% ROC at max; 1.18% at 50% max.
Will generally look to take profit at 50% max and/or roll out the short call on price's traverse of the short call strike to reduce cost basis further.
IWM - iShares Russell 2000 - About to Drop MoreI always say that Price will always follow the MFI so when you see a strong Divergence between the MFI and the Price Movement it's only a matter of time. I've shown my Price Point Expectations in the relatively near term though it generally doesn't move too quickly.

Similar formation?Very similar formation on the 15 minute chart.
Interested to see what will happen.

$IWM at Inflection PointEarly next week important inflection point as the rest of the market decides if its ready to join mega/large caps or flop. AMEX:IWM

$IWM: Topping out at top end of channelThis is a follow-up from my AMEX:SPY and NASDAQ:QQQ note:-
-> Classic top out with MACD peaking at +2.5x standard deviation and accumulated volume topping out at +3.5x standard deviation.
-> Very likely witnessing a lower high forming at 0.618x fibonacci retracement.

IWM Channel BreakoutIWM is trying to break back out of the channel it's been in since April 2022. It broke out briefly in late December, but was rejected. This second breakout attempt looks promising, and usually leads to ATH after this much consolidation. Lots of earnings reports this week, but if the market holds up, small caps should have some room to run.

$IWM Weekly Chart Bear FlagIf this pattern fails, best moves come from failed moves. The technical analysis for AMEX:IWM (Russell 2000 ETF) on the weekly chart indicates the formation of a bear flag pattern. In technical analysis, a bear flag pattern typically appears as a downward-sloping channel or rectangle on a price chart. It forms after a significant downward price movement, followed by a period of consolidation characterized by lower highs and lower lows. This pattern suggests that the downward trend may continue, with the potential for further price declines. Traders often interpret a bear flag as a signal to sell or short the asset in anticipation of further downside movement.

IWM: 4 Hour Bull Flag targeting Top of Ascending ChannelThe IWM(Russel 2000 ETF) is consolidating in what looks to be a Bull Flag and if it breaks out the target would take us to the top of the macro Ascending Channel which would take us to the resistance zone of $200-$210. If I had to guess I'd say IWM could likely make its way up to that level by the end of next week.

Gap & Go to $200 perhaps?If we hold this gap area, I'm willing to bet that we might make it to $200. I just saw what NFLX is doing for earnings despite okay #s. Looking fwd to seeing what tomorrow brings. 0
*IWM = small caps (stockanalysis.com)
**TSLA earnings after hours 1/24/24 - i remember when TSLA didn't participate in a rally post COVID. When ready to rip, it will rip!!!

💡 $357 profit with 72% PoP STRANGLE - #1 trade in my challangeTrade Overview:
Initiated my first options trade for the annual challenge on January 2nd with an IWM strangle. Observing high IVR in the index, I capitalized on the recent VIX spike to enter the 45DTE 212/188 strangle for 3.57cr.
Trade Management:
Rolling Strategy: Will roll legs as needed before expiration if price diverges.
Loss Management: With a FWB:12K account, I'm capping floating loss at $200.
Closing Strategy: Targeting to close around 21DTE.
Trade Details:
Symbol: IWM
Option Type: Strangle 45DTE
Entry Date: January 2, 2024
Entry Price: 3.57cr
Required BP: $1681
Max Profit: $357 (20% of capital)
PoP: 72%
Positions:
IWM Feb 16, 2024 212.00 CALL - Sell | Price: 1.76 | Qty: 1 | R. PnL: 0 | Commission: 1.251 | Fees: 0
IWM Feb 16, 2024 188.00 PUT - Sell | Price: 1.81 | Qty: 1 | R. PnL: 0 | Commission: 1.2511 | Fees: 0
Key Metrics:
Tasty IVR: 42 (High)
Breakevens: 184/215

Russell 2000 ralliesThe three major US stock indices eked out modest gains yesterday to mark fresh record highs. The Dow Jones Industrial Average ended above 38,000 for the first time ever. But the best performance came from the Russell 2000 which closed up 2.0%. This is the US’s ‘mid cap’ index. It is a broad-based look at smaller US companies covering a wide range of businesses which are more domestically-focused than the three majors. It isn’t overly-weighted towards tech or financials. In fact, its largest sector which accounts for over 17% of the index, is industrials. Consequently, the Russell 2000 is thought to be a better barometer of the state of US business world than the other majors. It has lagged both the S&P 500 and the NASDAQ 100 for a while now. Last year it rose 16%, compared to a gain of 24% for the S&P and 43% for the NASDAQ, although it did beat the Dow which ‘only’ managed to rise 13.5%. More significantly, it is currently around 18% below its November 2021 record high, so it certainly has some catching up to do. Or the three majors have some catching down.

Opening (IRA): IWM Feb 16th 187 Monied Covered Call... for a 183.65 debit.
Comments: Doing things a little bit differently here, buying stock and selling the -75 delta call against to emulate the delta of a 25 delta short put, but with the ability to immediately defend the position with the short call, rather than waiting to roll the short put.
First, the metrics:
Max Profit: 3.35 ($335)
Buying Power Effect/Cost Basis/Break Even: 183.65
ROC at Max as a Function of Buying Power Effect: 1.82%
ROC at 50% Max: .91%
Delta/Theta: 23.1/6.31
Now, the why ... .
Previously, I looked to ladder out short puts targeting the shortest duration <16 delta strike paying around 1% of the strike price in credit and utilize a portfolio-wide short delta hedge which used buying power to put on and maintain.
Here, I'm looking to manage risk on a per-position basis and to take advantage of some IV skew on the call side (i.e., the IV on the call side is greater than the IV on the put side at the correspondent put strike). Because of this, the premium/max profit is a smidge richer doing things this way relative to just selling a put.
This only makes sense in a cash secured environment, where you don't get much BP relief going short put over covered call. On margin, this wouldn't make a lot of sense from a buying power efficient standpoint, so I'd use a different setup where I could manage side risk more effectively (e.g., short strangle, iron condor, Jade Lizard). Naturally, there are more BP efficient, IRA-friendly setups (e.g., Poor Man's Covered Call), but they have some warts of their own.
From a trade management standpoint, I'll still look to take profit at 50% max, as I would've with the short puts and look to roll out the short call for a credit if it's tested, reducing cost basis further and improving my break even. Since I have nothing on here, I'm going shorter duration than I ordinarily would, but will start building out in longer duration at intervals as I did previously.
On a side note, most people (unscientific survey, gleaned from culling through relevant Reddit posts) who "wheel" or do covered calls do not like this setup because it caps out profit, and I fully understand the preference to sell out-of-the-money calls against your stock and manage the position from there, particularly if the stock pays dividends that are decent. My personal preference, however, is to book realized gains "liberally," have a minimal of crap piles on at any given time, and generate a fairly regular cash flow. As we know from the past year, the market doesn't always go up, and the important thing is to be able to reliably make money in up, sideways, and to a certain extent, down markets with a minimum of headaches which is what these setups (out-of-the-money short puts, monied covered calls) allow me to do. Does it have a hugely sexy ROC that I can show off to chicks at bars? No. Does it pay for the bar tab? Certainly ... .

$IWM Potential Bullish SetupA trend continuation inverse head and shoulders pattern here would be so bullish for small caps.
AMEX:IWM
#LetsGo! #Bulls
AMEX:SPY NASDAQ:QQQ


IWM BULLISH PROJECTION 2024This is a bullish projection for the IWM in 2024.
IWM may retest the GAP around 180 and make a breakup.

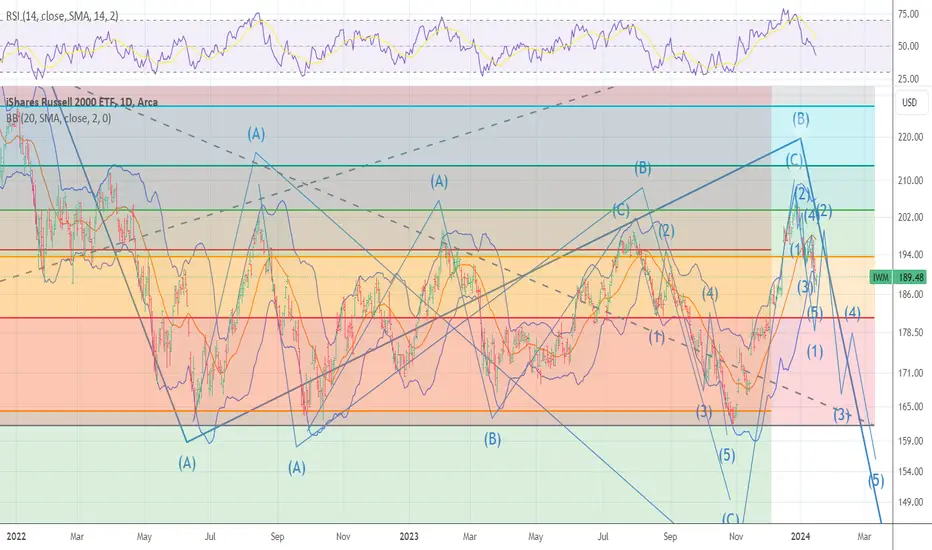
IWM 5 waves DOWN wave 1 of 5 of C of CRASH CYCLEI have down ended 5 waves down .We should now see a rally back to 198/199.6 for wave 2 . This should also see the sp 500 print of 4821 min and the dji into 38200/38400 SUPER CYCLE TOP
IwmHuge double bottom forming off off support here..
1st target is 197 gap close
2nd target is 200 gap close
Might go higher lets see what happens
