Trend Line in Play - Imminent Advance in Small Caps?Small Caps look the least extended in this equity rally and I really like the tight ranges before it advances to it's next box. My analysis puts IWM imminent on its next advance upwards. Put this trade idea under: "The trend is your friend until it bends".
IWM trade ideas

$IWM // May 19 2026 // Analysis & Targets for Day TradersAMEX:IWM // May 19 2026 // Analysis & Targets for Day Traders

IWM: Let's see we get this position :D I won't celebrate early, but I will be cautious, and watchout for the trap. The sell is set at 10:30. I Have $100 backup might go all in today.


I am betting big on this. Let's see what we get. My Ai is not working right now so working. I don't know how to explain but I see the double top structure forming there. Maybe we see a pump today?

$IWM // May 16 2026 // Analysis & Targets for Day TradersAMEX:IWM // May 16 2026 // Analysis & Targets for Day Traders
This is for the May 16th contract.
Full Walkthrough on this mornings video

$IWM Analysis, Key Levels & Targets for Day Traders // May 15 25AMEX:IWM Analysis, Key Levels & Targets for Day Traders // May 15 25
Let's go, we had PPI in premarket w// Powell... Today's range looks fun.

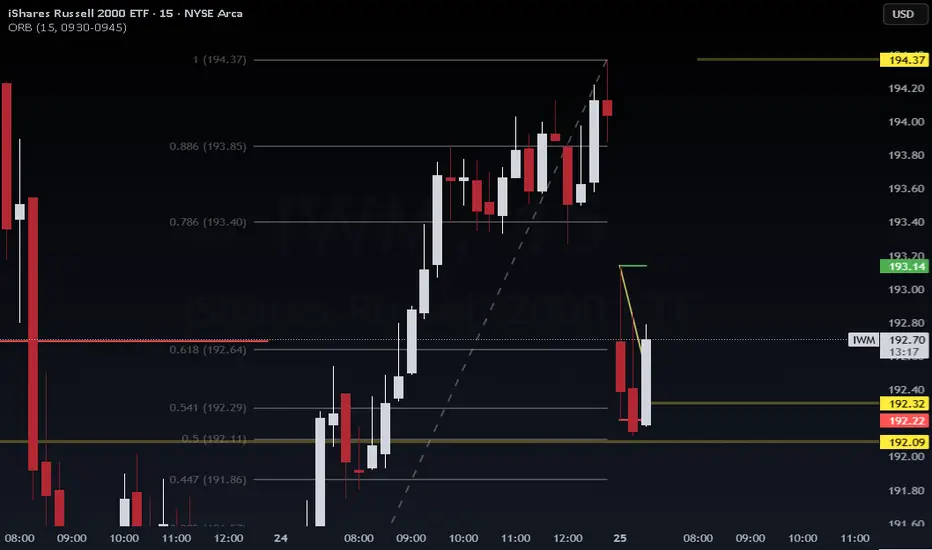
IWM: Going to pump? Quick trade setup**IWM 15m – Smart Money Concepts + ORB Breakdown**
_Published by WaverVanir_International_LLC on May 14, 2025_
**Setup**
- ORB (09:30–09:45) established supply at **209.30** (Weak High) and demand near **206.62–206.27**.
- Smart Money Concepts zones:
- **Premium (Supply):** 209.30
- **Equilibrium (Fair Value):** 208.52
- **Discount (Demand):** 206.57–206.21
**Price Action**
1. **Break of Structure (BOS)** below the recent consolidation low signals bearish continuation.
2. Retracement tested the **38.2–61.8% Fibonacci** levels (~208.67–208.09), aligning with Equilibrium (Investopedia, n.d.-a).
3. Failed reclaim of Premium confirms seller strength.
**Trade Plan**
- **Entry:** Short on bounce failure at Equilibrium (~207.80)
- **Stop-Loss:** Above Premium (209.30)
- **Targets:**
1. Discount Zone: 206.57–206.21
2. Extended: 205.71 (1.618 Fib)
**Risk/Reward:** ≥2:1
Stay disciplined—only trade with defined risk. GLTA! 🚀

$IWM, small caps, not YET giving the "all clear"AMEX:IWM is the lone index still not in the clear 🚩 — backtesting its 200dma today and tagging the weekly mid-BB , just like in '22. Will it matter by week's end? If not, the bull is likely back across the board 🐂
This week's #CPI (Consumer Price Index) and #PPI (Producer Price Index) prints could significantly influence market direction across major indices — AMEX:SPY , NASDAQ:QQQ and AMEX:IWM — especially with rate cut expectations in flux. 🧵Here's how:
1. Hot CPI or PPI (above expectations):
AMEX:SPY : Likely to pull back as sticky inflation pressures broader S&P names, especially rate-sensitive sectors like real estate and utilities.
NASDAQ:QQQ : Could see sharper downside—tech stocks (many of which are high duration assets) are highly sensitive to interest rate expectations.
AMEX:IWM : Likely the hardest hit. Small caps suffer from tighter financial conditions and depend more on domestic borrowing costs.
🟥 Result: Bearish across the board, with small caps underperforming.
2. Cool CPI or PPI (below expectations):
AMEX:SPY : Broad lift, particularly in consumer discretionary and financials.
NASDAQ:QQQ : Strong rally—mega cap tech loves the prospect of lower yields.
AMEX:IWM : Outperforms if cooling inflation suggests easing ahead, since it's more leveraged to rate cycles and domestic growth.
🟩 Result: Bullish, with small caps possibly leading a relief rally.
3. In-line CPI/PPI :
Markets may stay choppy or consolidate, with AMEX:SPY and NASDAQ:QQQ more stable.
AMEX:IWM remains at risk of drifting lower unless there’s a strong dovish narrative from the Fed or other macro catalysts.
With small caps already lagging, this week’s inflation data could either validate its bearish divergence or spark a rotation rally if inflation
AMEX:SPY NASDAQ:QQQ TVC:VIX $ES_F $NQ_F $RTY_F TVC:TNX NASDAQ:TLT TVC:DXY #Tariffs #Stocks

Update On My Positions And On The Bear Market RallyYes guys bear market rally she gonna fail
can we higher yes 585 but lets see Tomorrow
Fed day I don't see him raising or cutting
Thanks to all that follow and all the kind words
please let me know u don't understand anything
I will try my best to help. I hope the vol thing helped some one vol everything IMHO

IWM: ShortRussell 2000 ETF | 15-Min Chart | May 8, 2025
🚨 0.5–0.618 Fib Retracement Completed
Price has tapped into a key Fibonacci confluence zone (0.5–0.618), overlapping with previous CHoCH and unmitigated supply. This zone has historically triggered distribution phases on lower timeframes.
🔻 Technical Setup:
Price rejected from 198.4–198.7 zone
CHoCH and EQH levels form a liquidity trap above
Targeting demand near 193.78 (Fib extension 1.382 + historical support)
📊 Macro Context:
US Q1 GDP: -0.3% (contraction)
Core Inflation: Still sticky at 2.6%
Jobs Market: Strong, 177K added in April
Fed Today: Likely no cut, but any hawkish Powell tone could trigger a sharp risk-off move, benefiting this short bias.
🎯 Trade Idea:
Bias: Bearish
Entry: 198.35–198.70 (current level)
TP1: 197.43
TP2: 193.78
Invalidation: Break & hold above 199.50
⚠️ Wait for Powell @ 2:30 PM ET before scaling in. Volatility will spike.
#IWM #Russell2000 #Fed #SmartMoneyConcepts #Fibonacci #MacroTrading #LuxAlgo #RiskOff

IWM: 1Hr UpdateIWM is showing signs of short-term exhaustion after rejecting near $198. A break of the rising trendline suggests a pullback is in play. The $187.99 level is key support – a bounce here could trigger the next leg up toward $200.68.
🧠 Trade Idea: Monitor price action near $188 for long entries targeting $200. Stop below $186.
⚠️ Bearish confirmation only if we lose $187 decisively.
🔍 Probability Setup:
🔸 Bullish Bounce → 65%
🔸 Direct Breakout → 15%
🔸 Breakdown → 20%
📅 May 1, 2025
#IWM #Russell2000 #TradingView #TechnicalAnalysis #ETF

IWM: Trade PlanTechnical Analysis:
Rising Wedge formation clearly visible on the 15-min chart, typically a bearish reversal pattern.
Major horizontal resistance at $200.78 — a strong previous breakdown level, now acting as a supply zone.
Plan: Short near $200.78 with stop-loss slightly above the upper wedge boundary (~$202-203).
Target Zones:
First target: ~$190
Second target: ~$185 if momentum increases.
Momentum indicators (RSI, MACD) are beginning to show early signs of bearish divergence — momentum fading while price grinds higher.
Fundamental Context (April 28, 2025):
Macro Risk:
Small-caps (Russell 2000) under pressure as investors anticipate a potential slowdown in U.S. GDP growth Q2 2025.
Treasury yields remain elevated → Higher financing costs disproportionately hurt smaller companies (Russell 2000 heavily debt-sensitive).
Earnings Season:
Mixed earnings for small and mid-cap companies; many struggling to beat analyst expectations.
Federal Reserve Outlook:
Futures pricing only a ~12% probability of a rate cut at the May FOMC meeting (CME FedWatch Tool, 2025).
"Higher for longer" interest rate environment is a headwind for IWM.
Market Sentiment:
Risk appetite cooling as VIX (volatility index) starts ticking up from multi-month lows.
Summary:
IWM faces a confluence of technical resistance, a bearish chart pattern, and growing fundamental pressure. Watching closely for rejection at $200.78 to initiate a short position with a measured risk/reward setup.
Hashtags:
#IWM #Russell2000 #TechnicalAnalysis #TradingSetup #ShortSetup #BearishWedge #SmallCaps #StockMarket2025 #MacroAnalysis

IWM: Short SetupPublished by Wavervanir_International_LLC | May 1, 2025
Thesis: Short-term weakness is emerging on the iShares Russell 2000 ETF ( AMEX:IWM ) as momentum fades following a steep vertical rally. A breakdown below the mid-band could trigger further downside into key support zones.
🔍 Technical Breakdown
Chart: 15-minute timeframe
Trend: Bearish short-term momentum
Key Levels:
Resistance: $195.64 (session high)
Mid-range Support: $194.45 (VWAP/mid-band)
Critical Demand Zone: $192.87
Indicators:
Price has pierced the upper Bollinger band and is now retreating toward the midline.
Strong rejection candle formed at the recent high, signaling buyer exhaustion.
Visual downward projection aligns with the VWAP deviation bands, reinforcing mean reversion expectations.
🧠 Probability Outlook
Bearish Continuation: 65% probability
Trigger: Break and close below $194.45
Sideways Consolidation: 25% probability
Trigger: Price holds above VWAP zone
Bullish Reversal: 10% probability
Trigger: Break back above $195.64 with volume
🔧 Strategy
Short bias favored with target at $192.87
Stop-loss: Above $195.80
Watch for increased volatility near macro catalysts (e.g., Fed rate decisions)
🧭 Stay disciplined. We trade probabilities, not certainties.
💬 Drop your thoughts and setups below 👇
#IWM #Russell2000 #DayTrading #TechnicalAnalysis #BollingerBands #MeanReversion #StockMarket #ETF #WavervanirDSS #MarketOutlook #QuantitativeTrading

Market Update - 4/27/2025Solid follow through, breadth has improved, a lot of breakouts this week, but I would be curious how we'll behave as we get closer to the 50dma on the indexes.
Until my market timing model shows a buy signal, I'm not gonna get aggressive, I'm still 50% invested and looking to take profits into strength, rather than entering new positions.
I'm still relatively flat for the last 2 months in my equity curve.
One thing I really need to improve is my risk management, especially around EPs. I need to reduce outsized losses (1% of my account) of which I had even 2 this month so far. And in general I am not that good with EPs, I need to study them closer.

IWM: This is going higher, are you long?Meaningfull discription is what I don't like because I use ML algos. Sorry but there is no justification on this. This will go higher, or I stop trading :P
SPY/QQQ ES/NQ 25 De Abril 2025QQQ Pre-Market Analysis – April 25, 2025
General Context:
The chart integrates SpotGamma levels, option walls, and potential reaction zones. It's designed to anticipate long trade setups based on call/put walls and retracement zones.
🔑 Key Zones and Levels
Zone/Level Description
464 – 465 (Put/Call Walls) Strong support zone, ideal for potential long setups (Buy Zone).
467.35 – RB Bottom First key resistance zone or target if price bounces from support.
469.51 – RB Head Second target/resistance based on call wall and options positioning.
471.59 – 470 (Call Wall) Final upside target. Possible reversal zone or strong supply zone.
🧠 Trade Ideas (Long Bias)
Scenario 1 – Early Bounce:
Entry Zone: Between 464 – 465
Target 1: 467.35 (RB Bottom)
Target 2: 469.51 (RB Head)
Target 3: 471.59
Scenario 2 – Retest Before Breakout:
Price may retest the Put Wall (2) at 464 before pushing higher.
This gives another buying opportunity with confirmation from price action.
Scenario 3 – Mid-range Consolidation:
Watch the 467.35 level for a breakout/rejection.
Above 467.35 with volume → bullish continuation toward 470–471.
⚠️ Critical Notes
Vol Trigger @ 466: This is a pivot level. Holding above suggests bullish bias; below = caution.
Zero Gamma Level @ 466: Another critical inflection point—watch reactions here closely.

IWM Has Bottomed but Not Ready Yet for Trend ShiftWhat Price Action Says:
After a sharp decline, IWM has experienced a 15% rebound, signaling the end of the bearish trend. However, this doesn't mean the market is ready to shift upward just yet.
For now, the most probable scenario is sideways movement, likely continuing through the end of Q2. A sustained upward move will require confirmation of a clear bottoming process, which has not been seen at this stage.
Key levels to watch are support at 185 and resistance at 200. Until we see more confirmation of a stable base, expect the market to remain in a consolidation phase.

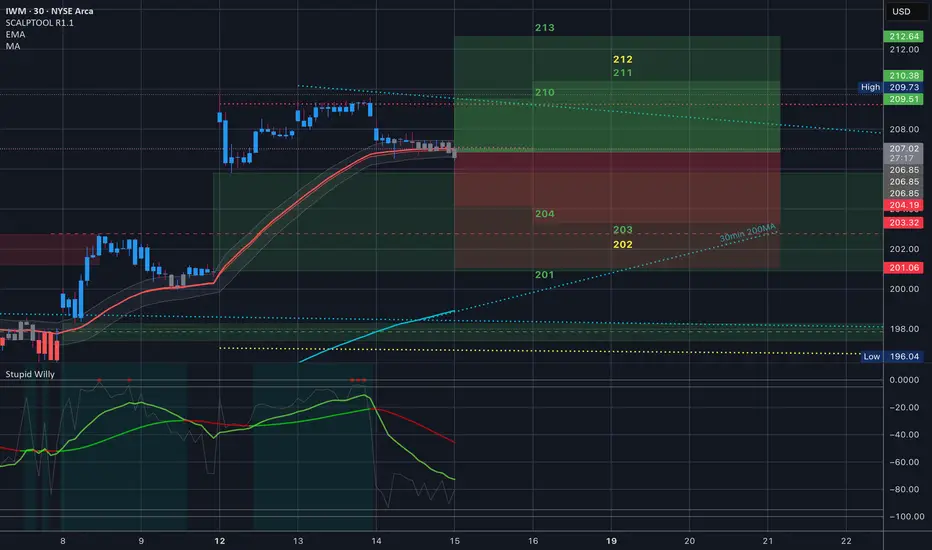
$IWM - Recap of Last Week April 14-17
Last week we had a shortened Trading week because of Good Friday.
We opened last week on Monday with a gap up right into the bear gap and got pushed out. From there we dropped down to the 35EMA and bounce there to just underneath that bear gap again.
Tuesday tried to get further into that gap and got pushed out again.
Wednesday and Thursday we regrouped and stayed close to the 35EMA which is still underneath the downward facing 30min 200. We did drop underneath that 35EMA on Wednesday when Jerome powell spoke and then reclaimed it on Friday!!
So Last week can be summed up in small caps as we got pushed out of Trumps Week gap from the week before and consolidated back to the 35EMA

$IWM - Recap of Last Week April 14-17
Last week we had a shortened Trading week because of Good Friday.
We opened last week on Monday with a gap up right into the bear gap and got pushed out. From there we dropped down to the 35EMA and bounce there to just underneath that bear gap again.
Tuesday tried to get further into that gap and got pushed out again.
Wednesday and Thursday we regrouped and stayed close to the 35EMA which is still underneath the downward facing 30min 200.
So Last week can be summed up in small caps as we got pushed out of the interest rate gap from the week before and consolidated back to the 35EMA

Market Update - 4/20/2025Breadth improving, a lot of stocks are starting to set up, there were even a few breakouts last week which is all constructive. Metals and miners are still leading, as well as defense names. NASDAQ:MVST is looking the best, have a good sized position in it, let's see how it evolves next week. I still remain defensive though, only 3 positions.

IWM Diamond BottomLove this diamond bottom pattern. Wait for a clear direction and watch for the news!!!
