IWM BreakdownIWM breaking down. Next area of support looks like it will be around $145 ish. If IWM continues to breakdown, it will drag the overall market lower...look out below
IWM trade ideas

IWM BounceLooking to play the bounce of the IWM.
Thesis:
Seasonality looks good for an end-of-year rally.
Interaction with lower channel trendlines that have bounced before.
Negative Divergence on the RSI.

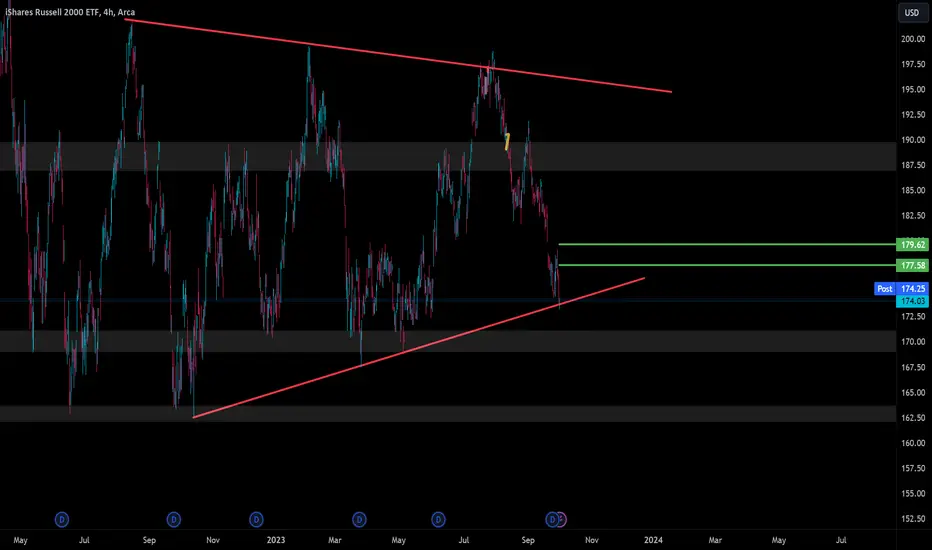
IWM: Make or BreakIWM closed in a very precarious spot.
Its really make or break here. If we bounce, the green lines are my TPs on the week with major resistance at that supply zone starting at 186.
If we break down, the demand zones are outlined below, but we don't have any major support until 171.
Let's see how we start off tomorrow.
IWM/SHY Sell SignalClear perfect H&S top in the IWM/SHY ratio chart. Predicts that short term bonds will now outperform the Russell 2k and the target of the pattern is a new low in the ratio. This implies that the Russell is likely to break to new lows while short term bonds should remain strong. If short term bonds were to decline at the same time as the Russell, the decline in the Russell will be more severe.

IWM: small-cap firms at risk as prices decline (27/09/2023)Recently, small-cap companies, in particular, have been adversely affected by the Federal Reserve's interest rate hikes. The Russell 2000 index is down 7% since the beginning of September. According to Ned Davis Research, 30% of the companies in this index have floating interest rates on their debt obligations. In contrast, only 6% of firms included in the S&P 500 index have borrowed funds under similar terms. This explains why small-cap companies are the most vulnerable to the tight monetary policy of the American Central Bank.
Considering these developments, it might be interesting to examine instruments that reflect the value dynamics of small-cap companies. Today, our focus is on the IWM ETF chart (NYSE: IWM), which invests in companies comprising the Russell 2000 index.
On the D1 timeframe, resistance has formed at 178.50, with support at 177.05. This level was broken through on Monday 25 September 2023, and a new support level has not yet been established. There is also a clear downward trend on the H1 timeframe. The price could drop to 168.25 in the short term and to 162.45 in the medium term.
—
Ideas and other content presented on this page should not be considered as guidance for trading or an investment advice. RoboMarkets bears no responsibility for trading results based on trading opinions described in these analytical reviews.
The material presented and the information contained herein is for information purposes only and in no way should be considered as the provision of investment advice for the purposes of Investment Firms Law L. 87(I)/2017 of the Republic of Cyprus or any other form of personal advice or recommendation, which relates to certain types of transactions with certain types of financial instruments.
Risk Warning: CFDs are complex instruments and come with a high risk of losing money rapidly due to leverage. 72.87% of retail investor accounts lose money when trading CFDs with this provider. You should consider whether you understand how CFDs work and whether you can afford to take the high risk of losing your money.

Russell 2000 at support levels. We have discussed the Russell 2000 head and shoulder pattern and long term double top on many venues, whether this weekend's Week Ahead" video, or on our daily FACE shows, it's a familiar chart. However, the daily RSI has just reached oversold. Oversold and become MORE oversold and the pattern targets are actually towards 2022 lows, but the 78% retracement of the March lows to July 2023 highs is at 174.42, and the ascending trend line of the Oct 2022 lows to present day is not far away. These may be levels that provide a bounce and better levels to be on the short side like closer to 180 vs where we currently trade at 174.50.

Potential downside targets (Russell)Potential downside targets for Russell 2000 based on location, trend, and structure.

$IWM: A Bounce Worth Trading?Looking to see if IWM can get a relief bounce here that could be worth trading. We'll stay tuned and find out


$IWM Head & Shoulders PatternAMEX:IWM Head & Shoulders Pattern, The Russell 2000 ETF (IWM) is currently displaying a Head & Shoulders pattern, a classic technical analysis formation often considered a reliable predictor of future price movements. In this pattern, the "head" represents a peak that is higher than two other peaks, known as the "shoulders." Generally, the pattern signifies a potential reversal in the prevailing trend—indicating a bearish reversal after an uptrend or a bullish reversal following a downtrend. Traders and investors often watch for the neckline, a support or resistance line connecting the lows of the pattern, to be broken as confirmation that the pattern is complete and that the anticipated trend reversal is likely to occur.
FOMC pauses Rate Hikes - QQQ/ SPY/ IWM/ DXYWhats next for the markets?
A complete collapse? A blowoff top? Sideways Chop?
Lets discuss some pivotal price action

If you count with a market crash this one goes firstMonthly timeframe chart. Price is building up a huge bearish flag, it may try another push to the flag resistance (I would open a short then) but it doesn't look good at all for the Russell 2000. Another strategy is to open a small position now and add if price hits the resistance and is rejected or add is price breaks down the flag support in the weekly timeframe. This is a long term trade it could take several weeks to play out. TP at 145 support. SL at 205 level.

Is IWM going to give up yet?This ticker is not looking good. A Head and shoulders pattern looks like it wants to play out. Huge volume by price desert with a gap to fill down around $176. Seems inevitable. Let's see if we get a neckline break this week.

$IWM - Potential Head and shoulderAMEX:IWM was rejected from upper trend line and it is now forming a head and shoulder pattern. It is currently near the neckline area which is also the 200-day moving average.
If the price breaks below $180 neckline, it can see further breakdown to $172 - $170 area with $177 being a good support and a possible reversal area in between.
If the price can bounce from here and climb back above $192, the pattern will invalidate.
The Day Ahead: IWM, QQQ, TQQQ, GDXJ, FXI, EWZIt's Friday and a Triple Witching to boot!
Well, IV isn't great here pretty much across the board for us premium sellers. Nevertheless, if you must play (and some of us gotta), here's what's shakin' ... .
Broad Market
QQQ, .8 IVR, 17.8% 30-day IV, with the shortest duration in which the <16 delta is paying greater than 1% of the strike price: December 29th.
IWM, .7 IVR, 16.8% 30-day, with the shortest duration in which the <16 delta is paying greater than 1% of the strike price: December 29th.
SPY, .9 IVR, 12.9% 30-day, with the shortest duration in which the <16 delta is paying greater than 1%: (Ugh), March (there is no February monthly yet).
Exchange-Traded Funds
Ideally, you want to hit these when IVR >50 and IV is >35%, but IVR is at rock bottom, with most skimming the very low end of their 52-week ranges. Sometimes, you just have to settle for what the market gives you.
TQQQ, 8.5 IVR; 52.6% 30-day.
GDXJ, .6 IVR; 31.6% 30-day.
FXI, 7.9 IVR; 29.4% 30-day.
EWZ, 2.8 IVR; 26.7% 30-day.
Fortunately, all of these are <$45/share, so you will be small in terms of buying power effect with the natural exception of the leveraged TQQQ, which your broker may require be cash secured on margin (which naturally makes it less sexy in that environment from an ROC %-age perspective).
Stay small and don't get all of your powder wet.

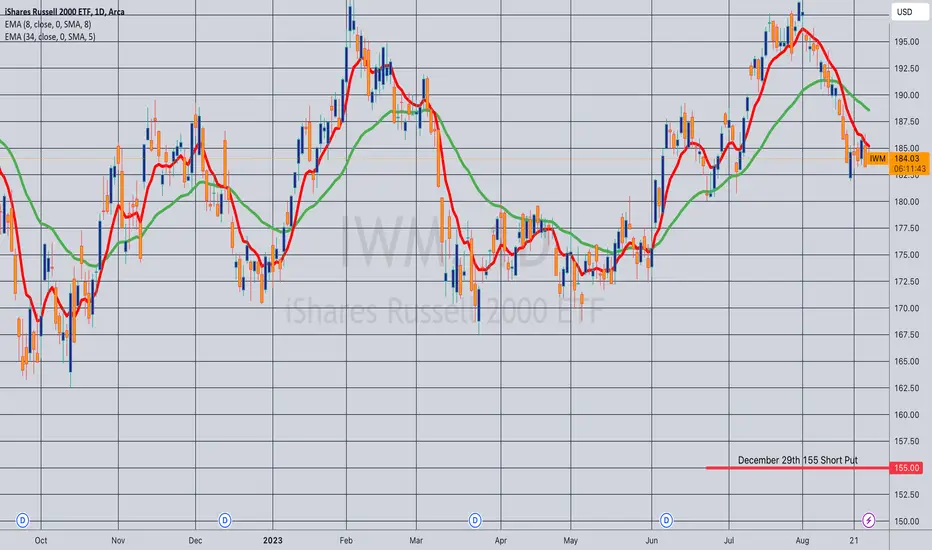
Opening (IRA): IWM December 29th 155 Short Put... for a 1.56 credit.
Comments: Rounding out rungs in the last of the available expiries in the 4th quarter, targeting the <16 delta strike paying around 1% of the strike price in credit to emulate dollar cost averaging into the broad market using short puts.
If I had nothing on in IWM, I'd probably go shorter duration (e.g., November 17th) where the 165 is paying 1.75 at the moment; I already have a rung at that strike, so am going out farther in duration to keep theta on and burning. The same would probably go for my Friday stuff in the Q's and in SPY.
Opening (IRA): IWM Nov/Dec 165/159 Short PutsComments: Targeting the <16 strike in the shortest duration paying around 1% of the strike price in credit to emulate dollar cost averaging into the broad market.
Filled the November 17th 165 for 1.71 credit; the December 15th 159, for 1.60.
Will generally look to take profit at 50% max or roll down and out for duration and a credit if tested.

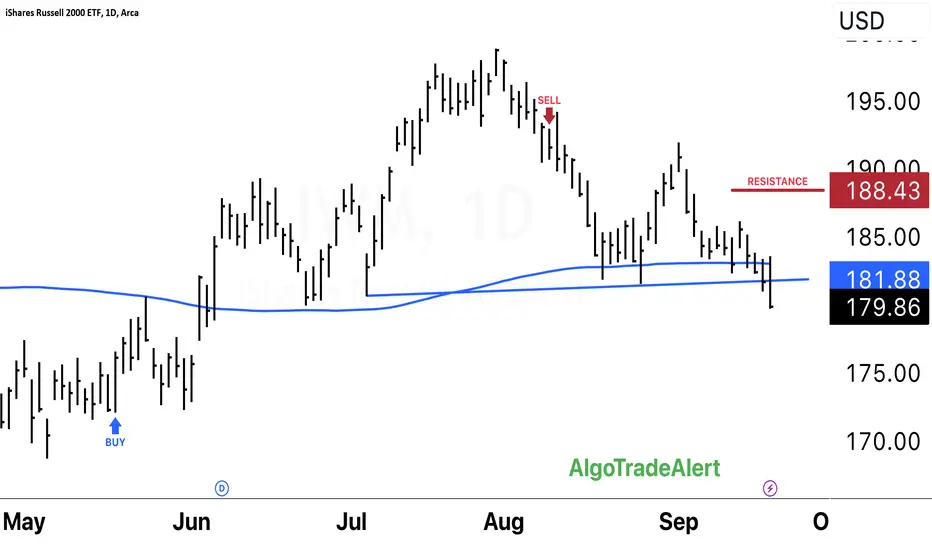
IWM looking vulnerableThe Russel 2000 closed below the daily 200 MA today.
It's never a good sign for the breadth in the market when the Russel starts breaking down.
I think there's a strong likelhood we continue to breakdown, based off todays IWM price action.
Small caps got rejected today at the pre market high and just kept selling all day. What makes thing price action bad is the fact that we closed below the pre market low and the daily 200 MA.
The volume on todays close was higher than usual which also indicates some serious selling pressure.
A clear Head & shoulders pattern is apparent on the chart, if this triggers...watch out below.

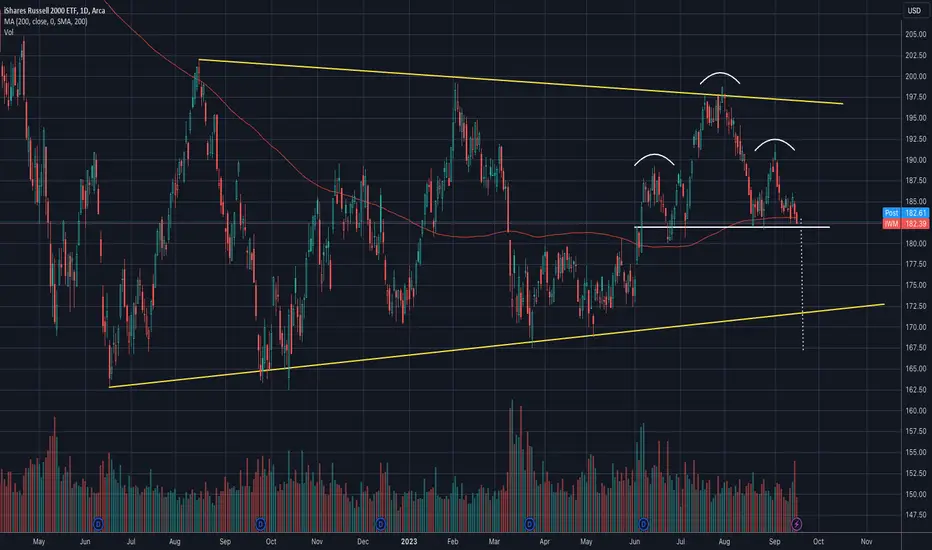
IWM - Ascending Triangle PatternIWM has been flip-flopping within an Ascending Triangle Pattern for the past 1 year+. It is no wonder that many of the smaller stocks are exhibiting wild flip-flops in the past months.
On a more optimistic note, an ascending triangle pattern has greater odds of breaking to the upside eventually. For IWM, this means a breakup above 198-199 could happen eventually (not guaranteed but good odds).
Until this happens, we might continue to see a very mixed/weak market especially for the smaller-cap stocks. Meanwhile stock picking skills with good money management is tantamont to traverse this market
If and when a breakup happens in IWM, it is likely the market bulls will be back in force.
Meanwhile, can only wait and see what happens.
Disclaimer:
TA is about improving our odds of a successful trade (not a guarantee). This is just my own analysis and opinion for discussion and is NOT a trade advice. Kindly do your own due diligence and trade according to your own risk tolerance and don't forget that money management is (probably the most) important! Take care and Good Luck!

The Day Ahead: Premium Selling in IWM, QQQ, FXI, GDXJ, SMHIt's Fryyyydayyyy ... (which is when I tend to do all my "stuff").
Well, unless you've been hiding under a rock (no judgment here), you'll know that premium-selling in broad market isn't very good here, with IWM IVR/IV at 12.3/19.7%, QQQ at 9.1/20.1%, and SPY at 6.8/14.4%. That sub-25 IVR is telling you that broad market IV is in the bottom quarter of its 52-week range which for premium-sellers is kind of drag.
Your premium-selling options in this environment (at least from a premium selling perspective) are to (a) do nothing; (b) sell your go-to delta and duration for whatever the market is paying, knowing that you might get assigned at the strike or have a poo pile to manage toward expiry; or (c) go longer-dated to get paid something decent with the probability of profit (POP) and or probability of touch (POT) that you're used to. Since I'm trying to create cash flow here (at least in the retirement account), I generally opt for (c), since I'm not fond of cleaning up poo piles with a great deal of frequency and like high POP/low POT. With that goal in mind, I generally target the shortest duration <16 delta strike that is paying around 1% of the strike price in credit.
Currently, the shortest duration <16 delta strike paying that in IWM is the December 15th 164 (14 delta, bid 1.65); in QQQ, the December 15th 325 (14 delta, bid 3.26); and in SPY, the Jan 19th 400 (16 delta, bid 4.24), so I'll look to add short put rungs in those durations or greater.
Because broad market sucks so hard though, I'll also be venturing out into the exchange-traded fund space to see if I can scrounge up any premium there. Currently, FXI (IVR 11.3/30.8%), GDXJ (7.6/30.3%), and SMH (17.6/28.7%) are at the top of my screener when sorted for 30-day IV, but you can see that IV is also at the low end of the 52 week range in that space, too. The ideal is to sell in both high IVR/high IV with IVR >50/IV>35% for ETF's, but there is nothing currently in the space with those metrics, so -- as with broad market -- you're options are the same: (a) do nothing; (b) sell your go-to delta/duration with the chips falling where they may; or (c) sell longer duration with your go-to POP/POT.
Here are the shortest duration <16 strikes paying around 1% of strike price in credit for these underlyings:
FXI, Dec 15th 22.85, 13 delta, bid .29 (don't know what the odd ball strike is about).
GDXJ, Nov 17th 29, 12 delta, bid .31.
SMH, Nov 17th 130, 13 delta, bid 1.35.
I would note that there is a highly options-liquid ETF with >50% IV, and it's TQQQ, with an IVR of 17.3 and a 30-day IV of (wait for it) ... 70.5%. It's a leveraged instrument, so I would exercise caution trading it with the expectation that, for example, the 16 delta (the 2 times expected move strike in non-leveraged stuff) is a "safe" strike to sell with limited assignment risk, a high probability of expiring worthless, and/or not being an in-the-money headache toward expiry. As long as you're familiar with all these "warts," it's probably okay to play small. That being said, it won't be particularly buying power efficient on margin; it looks like my broker's requiring that it be cash secured (most underlyings require 20% of the strike price or thereabouts in buying power), so the buying power requirement makes it "less sexy" in spite of its high IV.
Lastly, I would be neglectful were I to not mention the single name space for premium-selling here, but my general order of preference in selling premium (particularly in the retirement account) is (a) broad market; (b) exchange-traded funds; and (c) single name (in that order).
Here are the top 30-day IV, highly options liquid single name underlyings at the moment that are trading at >$20/share and with a 30-day>50%. There isn't a ton here and (as with everything else), IV is at the low end of its 52-week range (I mean 1.0? c'monnnn, you're killing me here, smalls):
AFRM (Tech/Software)), IVR/IV 1.0/75.5%
RIVN (Automaker/EV), 5.5/65.5%
TSLA (Automaker/EV), 11.3/52.7%

Opening (IRA): IWM Jan 19th 157 Short Put... for a 1.58 credit.
Comments: Targeting the <16 delta strike paying around 1% of the strike price in credit to emulate dollar cost averaging into the broad market. As I mentioned in my earlier post (See Below), shorter duration is probably paying, but I already have rungs on in the Nov 17th, Dec 15th, and Dec 29th expiries, so going out to 2024 here.
Naturally, I'll sell in shorter duration if I can get in at strikes better than what I currently have on.

Russell 2000 is CHEAP relative to S&P500AMEX:IWM long vs AMEX:SPY short
--------------------------
This is a "spread trade" between two indexes which is sometimes called a "pairs trade". Typically a "pairs trade" is between two similar stocks in a similar industry whose fortunes are tied together to a similar end user or buyer. Imagine NYSE:KO and NASDAQ:PEP (Coca-Cola vs Pepsi) as a decent example.
The typical "pairs trade" swings back and forth on expectations from different economic environments. The Russell 2000 ( AMEX:IWM and CME_MINI:RTYM2023 ) can be influenced by perceptions of interest rates and projections of economic activity. The rationale is that smaller companies like those in the Russell have higher dependency on borrowed money and will be hurt more in an economic contraction. They don't have the international reach and have more risk to the domestic economy and have lower borrowing capacity, which makes them overall more risky.
This isn't necessarily true, but it is the way the market views this trade and what gives it the potential to generate returns.
What this ratio tells me here is that expectations are very low for Russell 2000 companies and very high for S&P500 companies and that there may be risk to that assumption. Therefore, we should research into the actual facts and see if that is true.
The fact is that here at current levels the Russell2000 has lagged the S&P500 Index by 30% from the high in 2021 but in order for this ratio to move back to the levels of 2017-2018-2021, it would need to advance by over 45%.
How much do we risk in this trade here? The average "monthly" range in this ratio is about 4%, so we can risk about 4%-5% and admit we are wrong if the ratio slides under 0.41 (the bottom of the green box). The upside? Let's see how it moves, but the goal initially would be a gain of 3x the average monthly range or 12%-15%.
Tim 11:11AM EST 5/1/2023

IWM Head and shoulderAMEX:IWM has repeatedly zig zagged and it might actually be on the way to breaking down further with a well formed H&S
