IWM - the small caps get smallerBearish pennant "may be" done here. Above 203 on IWM and the idea is probably INVALID. I've pointed out the SPY/IWM monthly bull flag before (idea is linked below). If correct, it shows IWM losing considerably to the rest of the market. Why? Well I'm still wary of the Banks even though it's been a minute since anyone has really thought they are a problem. Interesting as KRE still looks completely bearish.
I believe IWM will lead the correction with Tech staying stronger for a short while. IWM bear pennant is hinting at a larger correction for the market, however if it's an ABC it would also be a wonderful buying opportunity when it's finished.
Good luck!
IWM trade ideas

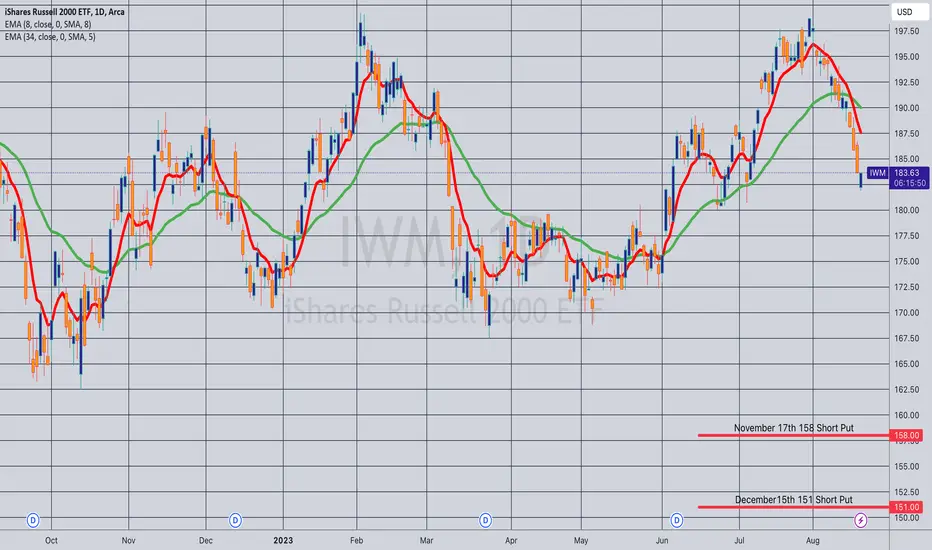
Opening (IRA): IWM Nov/Dec 158/151 Short PutsComments: Targeting the <16 delta strike in the shortest duration paying around 1% of the strike price in credit to emulate dollar cost averaging into the broad market. Generally, will take profit at 50% max, roll down and out for a credit if tested.
November 17th 158: 1.60 credit
December 15th 151: 1.51 credit
Russell is dancing on the clif"The Russell 2000 index (IWM) is currently displaying a weak and bearish pattern.
After a significant downward move, IWM formed a substantial symmetrical triangle, which is typically considered a bearish pattern, often referred to as a bearish pennant.
Around mid-July, the index broke out to the upside from this symmetrical triangle, marked with a circle. At that point, it seemed that the Russell was poised for an upward trend. However, a lesser-known pattern known as the 'death hook' emerged. The death hook, or fake breakout, is a potent trend reversal pattern that tends to occur during situations of fake breakouts or breakdowns. It appears that this pattern has manifested in the case of the Russell.
This suggests that the breakout was deceptive, enticing smaller market participants to enter the market before reversing course and moving sharply downward. While a minor bounce may occur, it's expected to be short-lived.
In all likelihood, the price will eventually break down from this bearish pattern and continue its descent. The only potential scenario for the bulls to regain control is if they intervene decisively, triggering another breakout to the upside accompanied by strong trading volume."

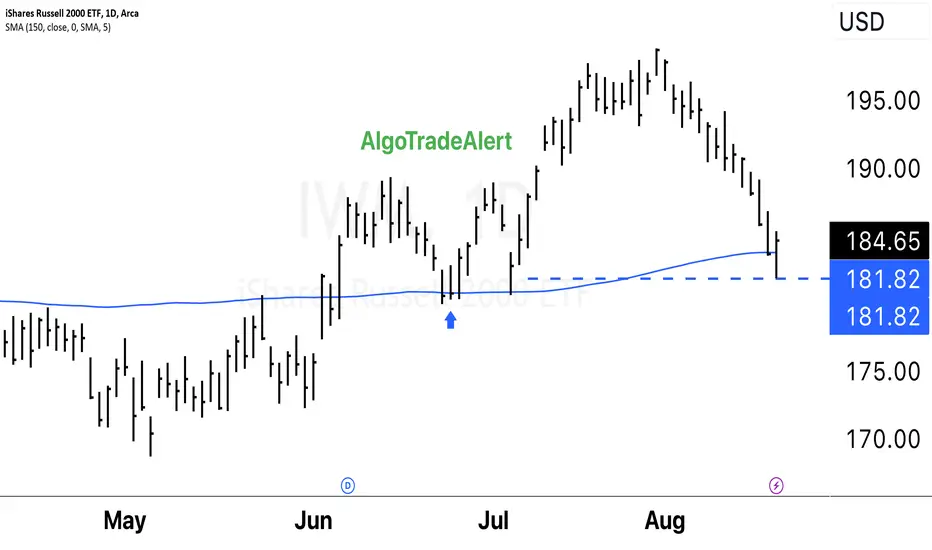
$IWM Bullish Daily Close AMEX:IWM Small Caps had a Bullish Daily Close. Tested my support level. Small caps will lead the broader market. The IWM is more sensitive to liquidity. I have been long since the blue arrow.
A "double bottom" is a bullish reversal pattern that occurs after a downtrend and is characterized by two consecutive lows at a similar price level, followed by a breakout above the pattern's neckline. This pattern suggests a potential reversal from the downtrend to an uptrend.
A "false breakdown" occurs when a price breaks below a support level but quickly reverses and closes back above it. This can be interpreted as a bullish sign, indicating that the selling pressure wasn't sustained, and buyers stepped in to push the price back up.
The idea that "the best moves come from failed moves" is a common adage in trading and investing. It suggests that when a market or a security initially breaks out or breaks down and then reverses, it can lead to strong price movements in the opposite direction. This is often attributed to the idea that traders who were positioned on the wrong side of the initial move are forced to close their positions, contributing to the momentum in the opposite direction.
It's important to note that while these concepts are commonly discussed in trading circles, they are not foolproof strategies. Technical analysis is just one approach to understanding price movements in financial markets, and it should be used in conjunction with other forms of analysis and risk management strategies. Markets can be unpredictable, and there is no guarantee that any pattern or signal will always lead to a profitable outcome.
IWM - Rising Trend Channel [MID-TERM]🔹Rising trend breaking downwards in medium long term.
🔹Between support 170 and resistance 199 in Rectangle Formation.
🔹Broken through support at 188, indicating a falling direction and predicting further decline.
🔹RSI curve indicates a potential early indication of a falling trend in the price.
🔹Technically NEGATIVE for the medium long term.
Chart Pattern:
🔹DT - Double Top | BEARISH | 🔴
🔹DB - Double Bottom | BULLISH | 🟢
🔹HNS - Head & Shoulder | BEARISH | 🔴
🔹REC - Rectangle | 🔵
🔹iHNS - inverse head & Shoulder | BULLISH | 🟢
Verify it first and believe later.
WavePoint ❤️

IWM BEARISH (16 AUG)The price of IWM is forming a bearish continuation chart pattern (the interest rate is 5%)
the chart show rejection at the resistance level for the 3rd times.
therefore, i decide to place entry here with stop loss above structure
take profit is at the low (demand zone weekly)

$IWM $RUTRetest of breakout still looks to be on track, plan to accumulate around the retest area depending on overall market conditions.

Calculating Options Expected Move I had a request to go over how to calculate the expected move from options.
As well, I posted my own indicator that does the calculations for you.
So, I decided to go over both, the theory and process for calculating the expected move from options and also the indicator and how to use it.
Hope you find it helpful!
Safe trades everyone!

IWM - Rising Trend Channel [MID-TERM]🔹Breakout resistance 179 in double bottom formation.
🔹Approaches resistance at 198 potential NEGATIVE reaction; upward break POSITIVE.
🔹Technically NEUTRAL for medium long term.
Chart Pattern;
🔹DT - Double Top | BEARISH | 🔴
🔹DB - Double Bottom | BULLISH | 🟢
🔹HNS - Head & Shoulder | BEARISH | 🔴
🔹REC - Rectangle | 🔵
🔹iHNS - inverse head & Shoulder | BULLISH | 🟢
Verify it first and believe later.
WavePoint ❤️

IWM ema strategy13 ema crossed up over the 21 ema on the D TF Thursday June 1st.
price crossed the 200 ema on the 4hr TF with above average volume on June 2. Missed my entry, but still opportunity for retest of 200 ema and will enter a paper trade.
Will close on the 13/21 ema cross sloping down and price under 200 ema on 4hr TF with above average volume.

IWM Symmetrical Triangle Hi all, this morning I want to make a post on IWM, one of my personal core holdings. For those who do not already know, IWM tracks the Russell 2000, which is a collection of the top 2000 small-cap US equities.
Fundamentally, we are beginning to see default rates jump within smaller companies and poorly equipped balance sheets not being able to handle the pressure. Looking at the sector weightings, I see 16% tech, 16% healthcare, and 15% industrials. These industries rely on debt for a large majority of their growth. Lots of small-cap companies rely on floating-rate debt (interest payments rise with higher rates) due to creditors wanting higher yields for taking on the perceived risk. Also, lots of these 'cheap money notes' are beginning to mature and will continue into 2025. When these companies need to acquire new debt, creditors will either A. require much higher yields than before or B. not provide any debt whatsoever.
Yields are a huge driver for growth.
Technically, I'm seeing a symmetrical triangle pointing to the downside. As we've completed a 5-wave move, we could see a sharp downturn for IWM.

Monday Market Update: SPY, QQQ, IWMHey everyone,
Posting my Monday market outlook.
Targets are as follows:
SPY:
Bullish Condition: 358.36
Bearish Condition: 456.18
High target (if bullish condition) 464
Low target (if bearish condition) 450
IWM:
Bullish Condition: 197.58
Bearish condition: 195.99
High target (if bullish condition) 200
Low target (if bearish condition) 192
For tech, I am looking at 385 to the upside.
If that is broken the immediate targets are 389 followed by 391.
If we break to the downside, the targets are 378 followed by 375.
My thoughts,
Safe trades!

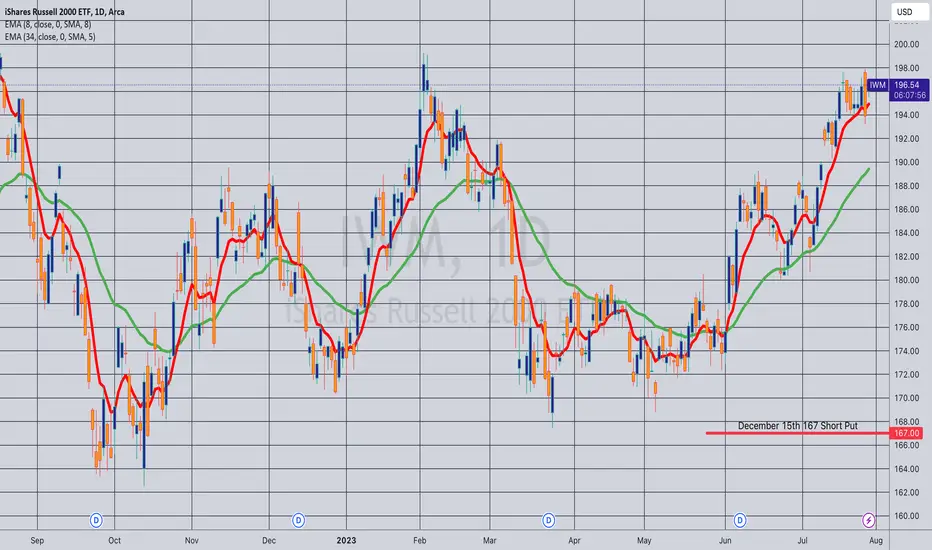
Opening (IRA): IWM December 15th 167 Short Put... for a 1.74 credit.
Comments: Going ahead and rounding out my broad market fourth quarter rungs here with an eye to adding in shorter duration if we ever get higher IV.
Targeting the <16 delta strike paying around 1% of the strike price in credit to emulate dollar cost averaging into the broad market.
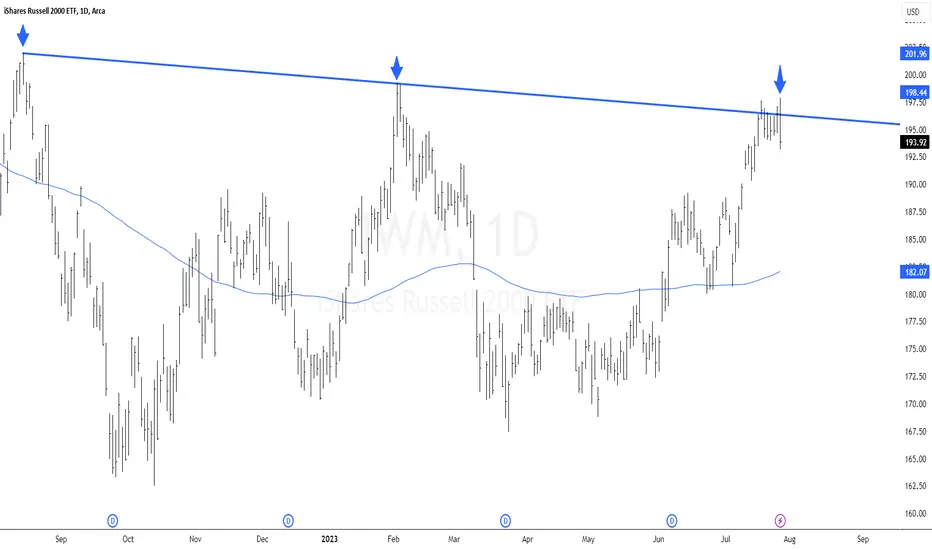
$IWM Trend Line TestAMEX:IWM Trend Line Tested
The Russell 2000 index tested its trend line today. This is a significant level, as it is the second time that the index has bounced off of this trend line in that started last year in August 16, 2022.
IWM Bearish Engulfing +5 CandleThe IWM ETF which tracks the Russel 2000 index put in an outside reversal, or bearish engulfing, candle today which eclipsed the 6 prior daily candles. When the body of a price candle completely engulfs the prior candle it is called a bearish engulfing candle. Since todays candle also engulfed the 5 candles prior to yesterdays it is called a bearish engulfing plus 5 candle(BE+5), for a total of 6 candles that were eclipsed by todays candle. The more candles that are engulfed by an outside reversal candle the more bearish the move and outlook.
Raising your stop-losses and/or taking some short bets against the market isn't a bad move here on an outside reversal day like today was, especially if markets close down going into the weekend. If markets close red on a Friday, they tend to close red the following Monday as well.

Market Updates: SPY, QQQ and IWMMarket update for the S&P (SPY and ES), the NAS (QQQ, NQ1!) and IWM.
Just my thoughts, not advice.
Safe trades!

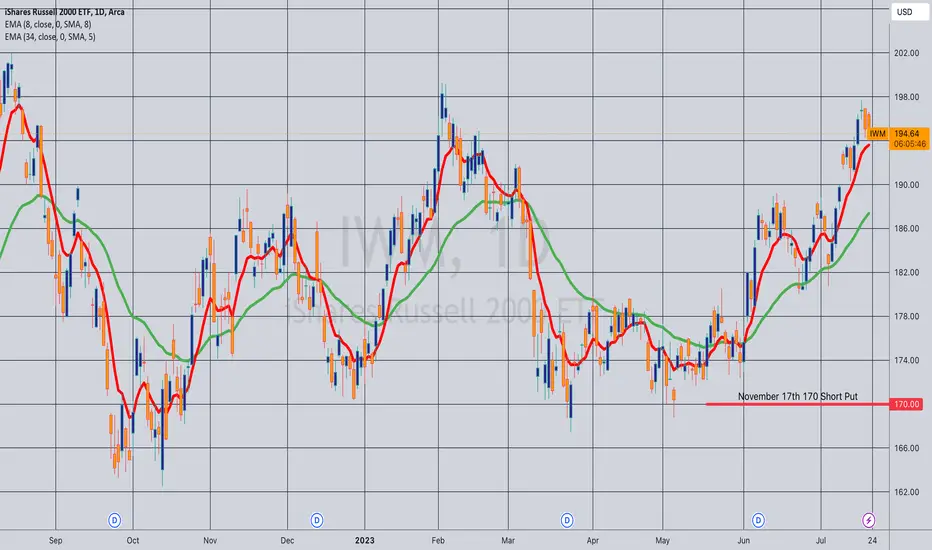
Opening (IRA): IWM November 17th 170 Short Put... for a 1.74 credit.
Comments: My weekly IWM short put in the shortest duration contract where the <16 delta is paying around 1% of the strike price in credit to emulate dollar cost averaging into the market without actually being in stock.
The fact that I'm having to go out to November to do this is a testament to how crappy premium is at the moment, but will look to add in shorter duration should we get an uptick in volatility and/or weakness.
Opening (IRA): IWM October 20th 166 Short Put... for a 1.73 credit.
Comments: Targeting the <16 delta strike in the shortest duration paying around 1% of the strike price in credit to emulate dollar cost averaging into the broad market.
As usual, will look to add in shorter duration and at lower strikes if we ever get an uptick in volatility at some point.

Technical and digital analysisWe notice that we have a divergence, and then we are in a correction to go down

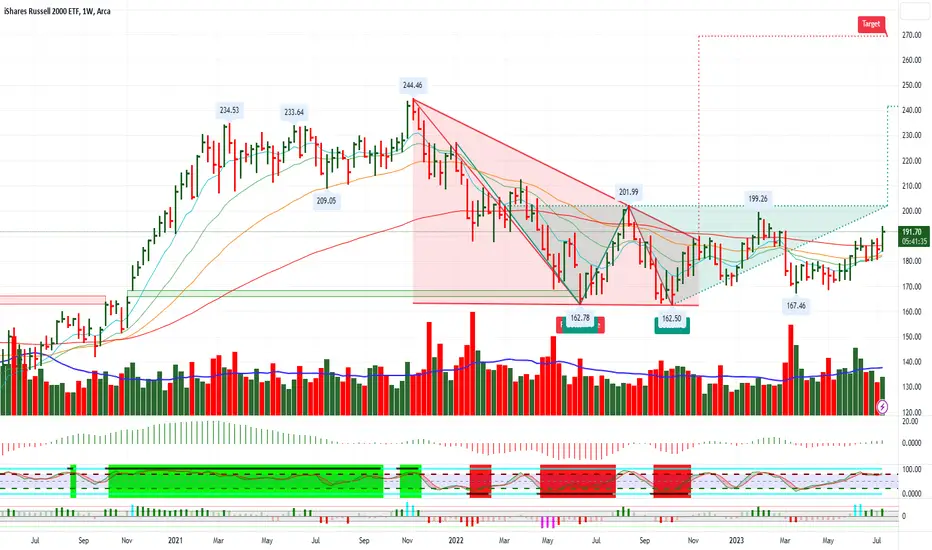
IWM - joining the bull party soon?Bull cycles usually start with heavy weight stocks (especially those in technology and discretionary) taking the lead, with small-caps usually joining the party at a later stage and when this happens, the bull run will be a lot more obvious by then.
The IWM (tracking 2000 small-cap stocks) had been stuck in a wide-ranging wedge since hitting a low in June 2022 and with this we experienced huge volatility when we attempted to long these stocks despite that they looked to have bottomed out.
A look at the monthly chart showed that the MACD is about to switch into the positive territory for the IWM, a significant indicator that it's longer-term outlook is starting to look bright(er).
On its daily chart, the 200-day moving average has even begun to exhibit a subtle upslope. Hence, I am hopeful that the IWM will be breaking out of the wedge above 198 in the near future (perhaps within a few weeks if not days).
It is no surprise that more and more of the smaller stocks are beginning to break up, despite that some still experienced a lot of volatility that could be difficult to sit tight. However, having a clearer vision of its longer-term outlook should give some confidence to dip our toes in for stocks with the right technicals and even if we were shaken out, the confidence to retest our entry when the technicals line up again.
Disclaimer: Just my 2 cents and not a trade advice. Kindly do your own due diligence and trade according to your own risk tolerance and don't forget that money management is (probably the most) important! Take care and Good Luck!

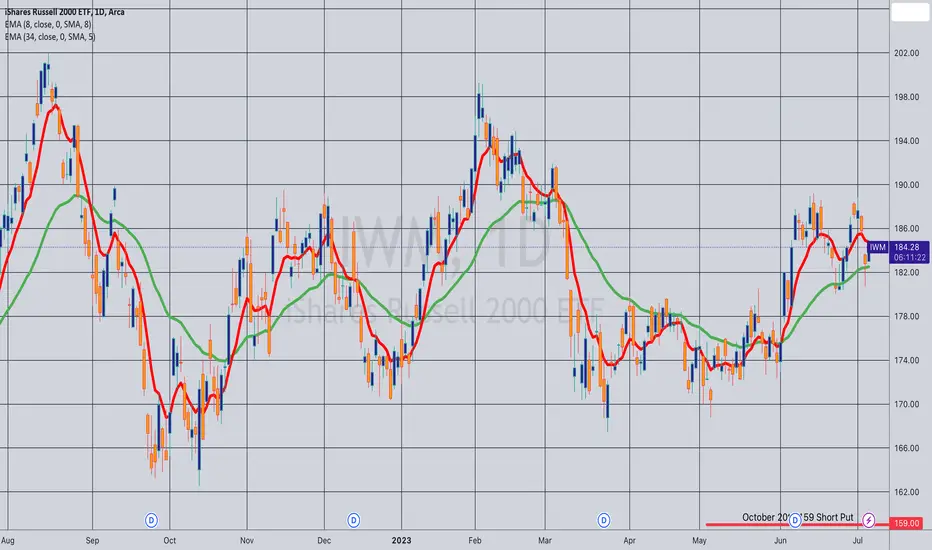
Opening (IRA): IWM October 20th 159 Short Put... for a 1.61 credit.
Comments: Targeting the <16 delta strike in the shortest duration paying around 1% of the strike price to emulate dollar cost averaging into the broad market.
$IWM July 14, 2023AMEX:IWM has my favourite patter.
Wedge
Double bottom.
second bottom lower than first.
Oscillator divergence.
looks good for 199.
Clos open above 201 very bullish.
But now a days index are behaving like stocks so i expect a good move here.
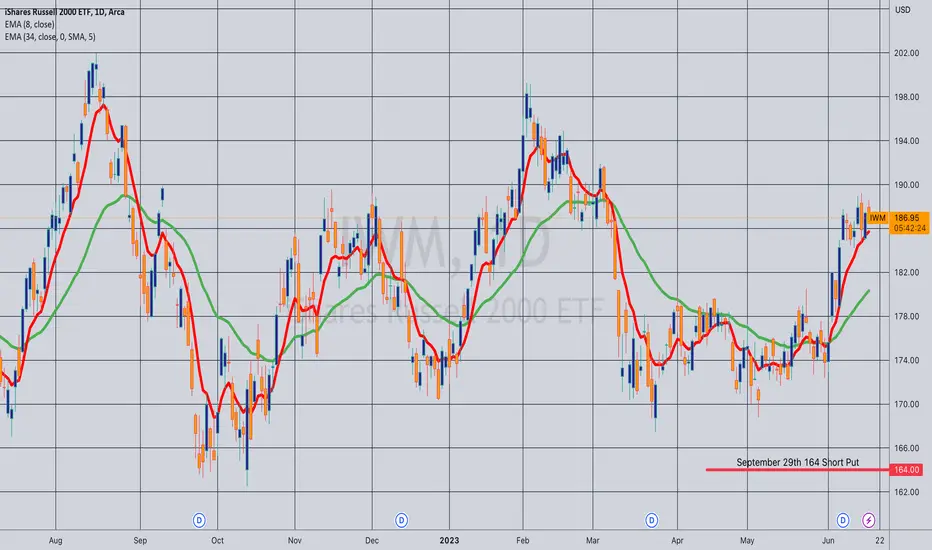
Opening (IRA): IWM September 29th 164 Short Put... for a 1.69 credit.
Comments: Selling premium in the shortest duration where the <16 strike pays around 1% of the strike price in premium.
This is less than ideal; you generally want to sell on weakness/higher IV, but am looking to keep theta on and burning. Will naturally look to add rungs in shorter duration/higher IV should the <16 strike start to pay.