The Russel is testing a weekly downtrend linePay close attention to the weekly trend line and the 200 days MA line
Going down?
Or are we heading toward a massive rally?
Time to make some decisions!
IWM trade ideas

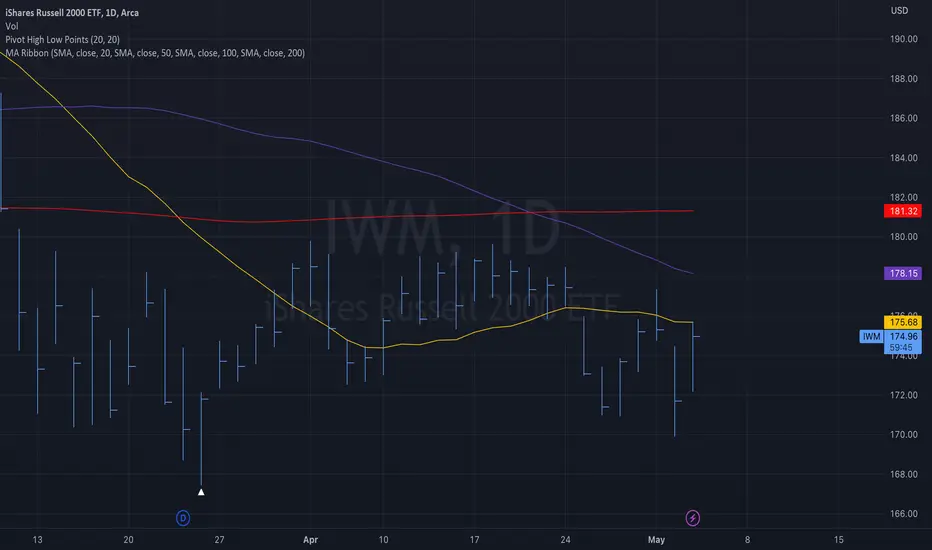
IWMBroke from under its 200sma today for the first time since March.
Currently outside Daily bbands sowe may see a pullback and we retest of 179-178..
Only bearish if we close back below 177.
Next resistance is 183 or weekly 200sma, if it breaks over that then IWM is headed back to 192.
Either wait for the 178 backrest or wait for a close above 183 to go long.

Opening (IRA): IWM August 18th 148 Short Put... for a 1.48 credit.
Comments: Targeting the <16 delta strike in the shortest duration paying around 1% of the strike price in credit to emulate dollar cost averaging into the broad market.

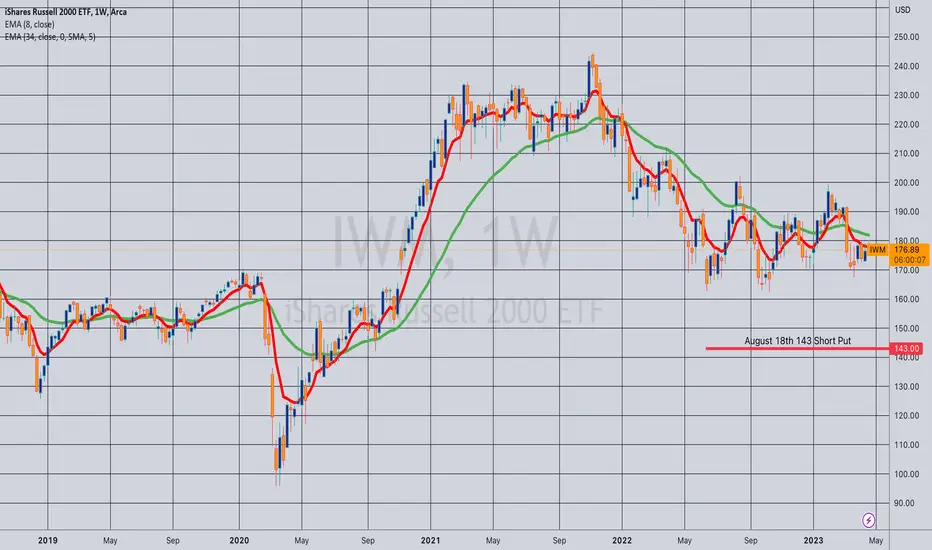
Opening (IRA): IWM August 18th 143 Short Put... for a 1.46 credit.
Comments: Starting to build out my short put ladder into the third quarter, targeting the <16 delta strike paying around 1% of the strike price in credit to emulate dollar cost averaging into small caps.
Using Pinescript for BacktestingA bit of a lengthy video on using pinescript to develop your trading strategy.
I just basically go over very basic functionality to get you on track if you have an interest in using pinescript for these functions.
If you are interested in seeing a little more advanced stuff or seeing how to repurpose pre-existing indicators into strategies, leave a comment and this could be a future tutorial!
I have also done a tutorial on using Excel to backtest your Strategy which is available here:
Thanks for watching!

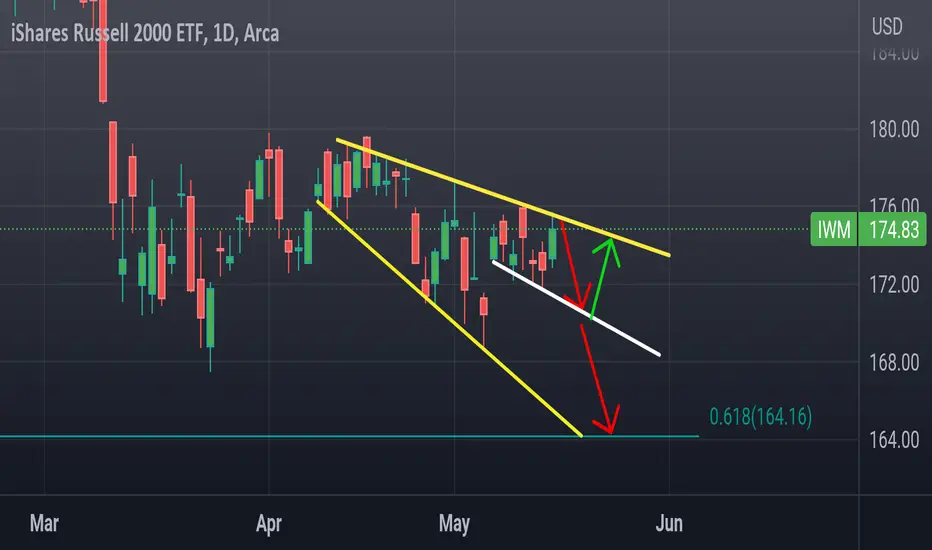
$IWM Outlook 05/30 - 06/02 @capgainsgroupAs the S&P 500 and the NASDAQ rally into the green for the year, the Russell 2000 (aka the small cap index) has lagged behind and is barely green at +1.03% YTD for 2023. One of the reasons why this index hasn’t been doing well can be attributed to the index’s 15.18% allocation in the Finance Sector. Failing regional banks such as Silicon Valley Bank ( NASDAQ:SIVB ) and Signature Bank ( OTC:SBNY ) haven’t helped the index much.
Investors who would like to play the Russell 2000 should pay attention to the 5 major sectors that makes up 73.23% of AMEX:IWM : Health Care (17.62%), Industrials (16.66%), Financials (15.18%), Information Technology (12.74%), and Consumer Discretionary (11.03%).
Technical Analysis:
AMEX:IWM recently formed a Death Cross (50 SMA x 200 SMA) on the daily chart in mid April. Although not very clean, there is a support uptrend line dating back to October 2022. Also, it seems like we have a head and shoulders pattern, using the Daily 170.30 level as the neckline.
Bulls will want price to reclaim the weekly 178.90 level as a support.
I lean bearish on this index. If AMEX:IWM can’t reclaim the two daily gaps above, at 176.74 - 177.42 and 180.53 - 181.28, I expect it to come down and test the yellow uptrend line and potentially break it to the downside in the coming weeks.
Upside Targets: 176.74 → 177.42 → 180.71 → 181.28 → 183.76 Extended: 186.91
Downside Targets: 174.09 → 172.33 → 171.41 → 170.30 → 169.32 Extended: 166.81

IWM has bottomed out, Upside potential toward 218IWM has bottomed out and is likely to head toward 218 by the end of this year.

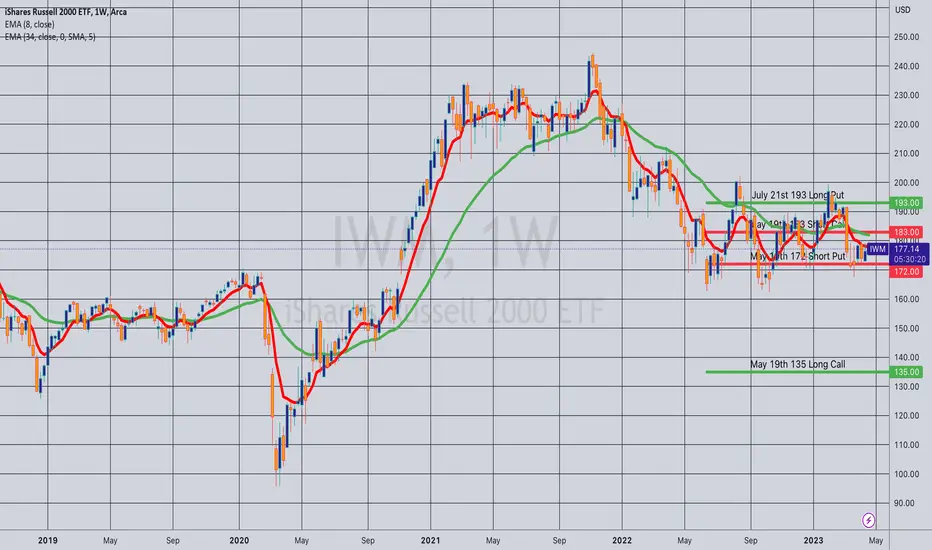
Opening (Margin): IWM May 19th/July 21st Double Diagonal... for a 56.60 debit.
Comments: Since my previous double diagonal in IWM was such a hoot (See Post Below), re-upping here. Buying the back month 90 delta strikes (both call and put) and selling the front expiry 30 deltas, with the result being a delta neutral setup on fill.
As before, I tend to manage each side individually, so keep track of both my global cost basis, as well as side cost basis and break evens. These start out as:
Long Put Diagonal Aspect (May 19th 172 short put/July 21st 193 long put):
14.17 cost basis/178.83 break even/21 wide
Long Call Diagonal Aspect (May 19th 183 short call/July 21st 135 long call)
42.43 cost basis/177.43 break even/48 wide.
As before, I'll look to roll out the short put aspects to the shortest duration 30 delta when the short option reaches 50% max that is at or above my cost basis (in the case of the short call), at or below my cost basis (in the case of the short put), liberally taking profit on sides should that happen.
Using Excel to Backtest your Strategy Hello everyone!
This is a tutorial video on how to use Excel to backtest your strategies using technical indicators on Tradingview.
This provides the foundations for you to get creative and have the essential tools and knowledge required to begin back-testing your strategies using Excel.
There is much more than can be done using Excel for back-testing, so if you are interested in seeing more in-depth functionality for more advanced back-testing methods, let me know below!
The essential functions in this video are the conditional functions of Excel. These are the "If" "Then" statements.
The code used to identify conditions are:
Single condition:
=if(condition1,"Result1","Result2")
More than One Condition:
=if(and(condition1, condition2, condition3, etc.),"Result 1", "Result 2")
If you do not have Excel, you can use OpenOffice which is opensource and free to use!
As always, let me know your questions and comments below!
Safe trades everyone!

U.S. Stocks final peakThe graph presented analyses SPX, IXIC and IWM; by valuing them against bonds adjusted dollar and gold. For explanation refer to the graph tagged.
Thanks!

Time series model indicatorHello all!
Releasing the time series model indicator later today.
Here is a brief instructional video and informational video about its use.
Leave any questions below or on the indicator's page once posted. I will link the link below once it has been posted.
Thanks for watching!

Opening (IRA): IWM July 21st 150 Short Put... for a 1.48 credit.
Comments: Targeting the <16 delta strike in the shortest duration paying around 1% of the strike price in credit to emulate dollar cost averaging into the broad market. IVR/IV isn't fabulous here at 1/22.7%, but will look to add in shorter duration and/or at better strikes in higher IV should we get it at some point.

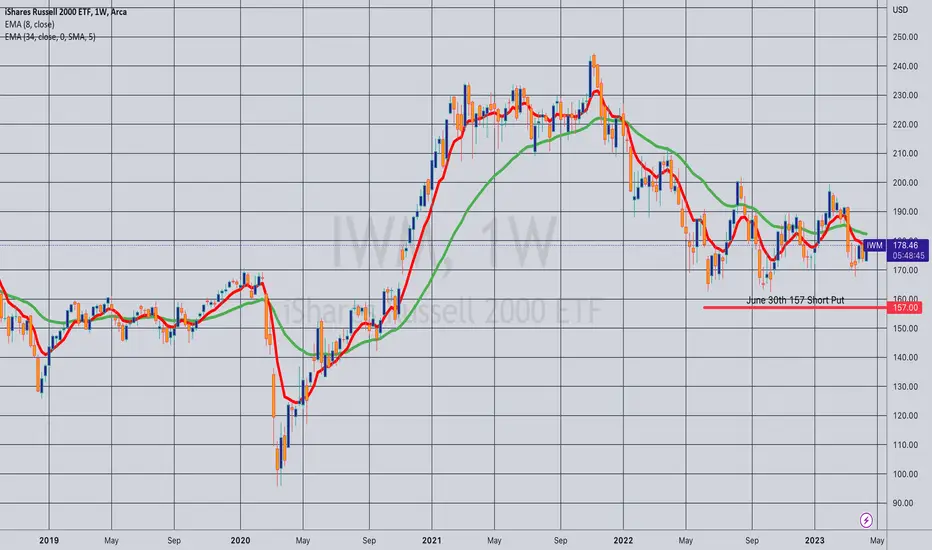
Opening (IRA): IWM June 30th 157 Short Put... for a 1.61 credit.
Comments: Targeting the shortest duration <16 delta strike paying around 1% of the strike price in credit to emulate dollar cost averaging into small caps.
This, admittedly, isn't an ideal premium-selling environment here, with 30-day at the very low end of the 52-week range, but will look to add at intervals and in shorter duration if that starts to pay again.
Rolling (IRA): IWM April 21st 176 to Sept 15th 161 Short Put... for a 1.71 credit.
Comments: Another "trouble maker" that I'm kicking the can on. Total credits received of 1.79 (See Post Below) plus the 1.71 here for a total of 3.50.


Opening (IRA): IWM June 30th 154 Short Put... for a 1.55 credit.
Comments: The weakness I would've like to had earlier ... . Targeting the <16 delta strike in the shortest duration paying around 1% of the strike price in credit to emulate dollar cost averaging into the broad market.

IWM approaching the resistance levelIWM has struggled in the past near the 175 level. I don't see MACD or volume enough to break this.

IWMIdk how significant a hidden bearish divergence is, but it's there on the weekly. Whole thing feels heavy. Feels like it'll end up being a false breakout of the blue trendline. I'm short via TZA. Stop is weekly close above 9 ema as it has been a brick wall the past few weeks. Watch out below $170.

IWM Broadening wedge here, long term bullish, short term bearish..
I think IWM is headed to 165 fibonacci support or Sept lows.
Has a split channel with support on the white trendline, I think It tags it in the next couple of days (170-171).
If it breaks below 170 we're headed to 165..
Today IWM closed above its 20sma but got rejected by its 50sma.
Use those MA as your entries.
Below 20sma - Short to white trendline
Above 50sma and that's a breakout.. target 177,180
Very bullish to me $IWM $RTYThat looks like a break out alright.
Perhaps another failed one, but I wanna be long anyway


$IWM Russel 2000 index Positive today The AMEX:IWM russel 2000 is up 2% today which is bullish for the regional banks
Watch Russell/IWM, banks are in thereKeep an eye on RUT Russell 2000 index for signs of bank troubles and smaller businesses. Smaller businesses will be more sensitive to economic changes.
