IWM Harmonic Elliott Wave AnalysisOverview: let's review the key points of published IWM update of August 20th:
The correction started from ATH is a wave 2.
So far, we have completed 2 zigzags of wave 2 and a third zigzag is about to come later this year.
Now, I believe that wave (X) top is in.
Update: I just need to publish the hourly chart to see how accurate was our previous prediction:
We are in wave c of 3 of A of (Z) of 2.
Levels to Watch:
1) Based on the volume profile of wave (X):
2) Based on support/resistance levels:
IWM trade ideas

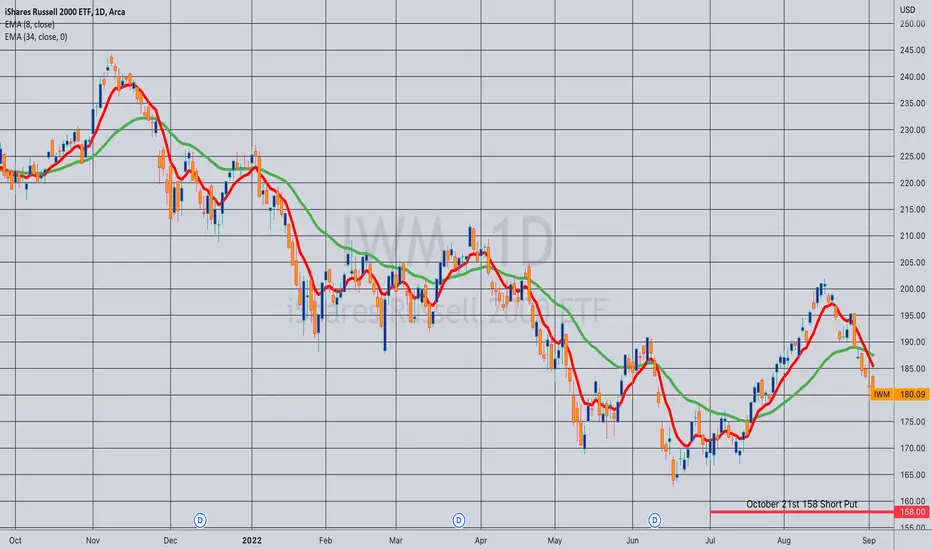
Opened (IRA): IWM October 21st 158 Short Put... for a 1.59 credit.
Comments: Late post ... . I think I missed this one in "The Friday Frenzy." Targeting the <16 delta strike paying around 1% of the strike price in credit to emulate dollar cost averaging into small caps.
IWM shortMonthly shows a beautiful hammer, however double bottom neck retest is close and may bounce up from there. Therefore, had to move my stop close.
Probably, will consolidate around bottleneck retest and make its decision there.
Ready to flip and go long into wave 5 of uptrend if confirms.

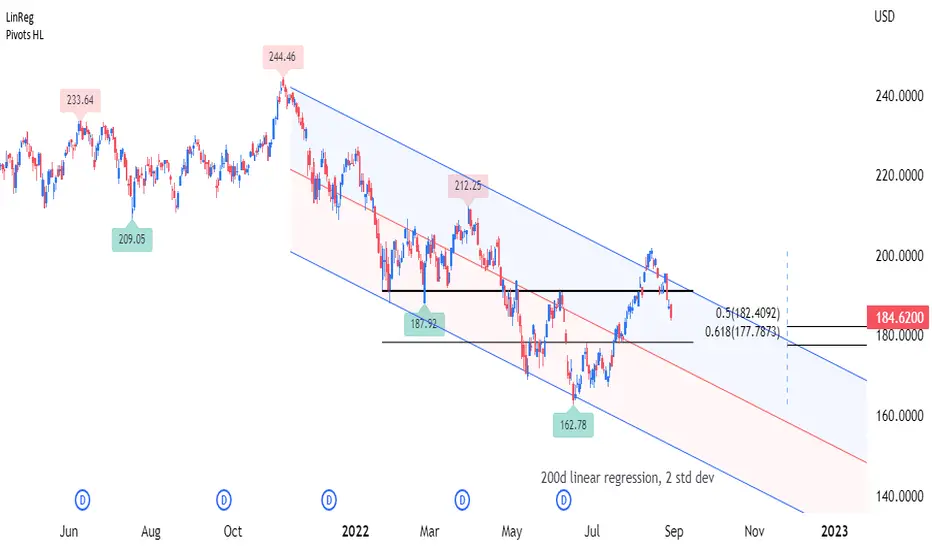
SMALL CAPS: Russell 2000 (IWM ETF)The ETF has shifted below it's prior demand-supply zone with the price trending toward it's 50-61.8% Fibonacci retracement zone. The 61.8% is also just above the previous breakout level seen on 20 July.
7-day Regime = Very Weak, Approaching 'Near Oversold'
14-day Regime = Weak
IWM hourly EW count IWM looks like it's at the end of wave 4 here. Getting very close to the high of wave 1. Entry long here provides good risk/reward. Stop below invalidation

Opened (IRA): IWM October 21st 161 Short Put... for a 1.62 credit.
Comments: Targeting the <16 delta strike in the shortest duration expiry paying around 1% of the strike price in credit to emulate dollar cost averaging into the broad market.


[Analysis] Russell 2000 , the crucial retestSmall caps are often the early risk on/off indicators. They are the first to rally during an economic expansion period, they are the first to dive are economic condition becomes more restrictive.
190 is a very crucial level for the Russell 2000. It act as a key support level in Feb 2022 and became the resistance in May/June 2022.
As Fed Pivot euphoria is slowing down, recession worries are becoming a bigger concern. Whether this current rally is a one-time wonder or the beginning of a bull market will be dependent on if the 190 level can hold.
Good News: The downtrend line is broken
Bad News: We have yet to see a higher low. This could also be the end of the recovery B Wave on a bigger downtrend
Unlike 2020 convid19, 2022's carnage is a systematic downtrend that is led by Federal Reserve's Policy (and their mistakes). As such, this bear market can and will be more drawn out.
If 190 is broken, 170 is the next support level.
Look out for Jerome Powell's statement during Jackson Hole's symposium.

IWM Harmonic Elliott Wave AnalysisIn this post, I am going to do a harmonic Elliott wave analysis of IWM .
I see IWM from 2000 to ATH of 2021 as a wave 1 and the correction started from ATH is a wave 2. So far, we have completed 2 zigzags ((W) and (Y)) of wave 2 and a third zigzag is about to come later this year. Note the main reasons I believe wave (Z) is coming:
1) Based on my view and count on ES;
2) The fact that the retracement of wave 2 so far has not been deep enough for a wave 2.
It is completely possible that wave 2 bottom is in since the bottom was almost perfectly on a fib retracement: the 0.382 retracement of wave 1 is 163.41 and wave (Y) bottom was 162.78!!
Now, I believe that wave (X) top is in. Regarding the fib retracement of wave (Y) on the daily chart , the 0.786 retracement was at 201.66 and high of wave (X) which occurred on August 16th 2022 was 201.99! Now let's look at the hourly chart of wave (X):
It can be seen that the structure of wave (X) is complete as a triple zigzag and the bullish channel is broken to the downside.

Opening (IRA): IWM July 15th 165/November 18th 200 LPD*... for a 29.95/contract debit.
Comments: Erecting a short delta hedge specifically against my IWM longs here, tailored to my specific delta needs, so I've gone with selling the front month 50 and buying the back month 90 for -40 or so delta per contract. (The math just worked out better with multiples of -40 versus multiples of -60; call me delta anal). I've already done a little bit of portfolio-wide SPY beta-weighted delta hedging here using SPY, but wanted to flatten out net delta a smidge further, particularly in my IWM position.
170.05 break even, paying 29.95 on a 35 wide with a max profit potential of 5.05 ($505)/contract.
Generally speaking, you want to address delta imbalances on an instrument by instrument basis first and then look at your portfolio-wide net delta to see if anything additional needs to be done (usually via a broad market, SPY beta-weighted short delta hedge). To a certain extent, this is why you always want to keep some dry powder around -- to adjust your delta on either a per-position or a portfolio-wide basis, some of which may or may not be buying power free.
* -- Long put diagonal.

Opened (IRA): IWM October 21st 170 Short Put... for a 1.78 credit.
Comments: Targeting the <16 strike in the shortest duration paying around 1% of the strike price in credit. This is more of "I need small cap long delta" than "this is a really great place to put on small cap long delta" trade, so probably not the best entry point to do this, although we're getting a little bit of weakness here today.

IWMFirst index to break RSI daily trend line. MACD hasn't rolled over yet on daily or weekly. Weekly RSI getting rejected on breakout from last week. Weekly AVWAP getting rejected. Most likely will come down for a lower high before pushing higher if it does. More likely to take out the lows first though. Depends on what the charts give in the coming weeks.

IWM: Bear is taking over#Ticker Symbol: IWM
#Timeframe: 4 Hour
#4X Bear Pattern
#Investment Strategy: short
TECHNICAL ANALYSIS:
----- Closed below 21ema -----
-----Money Divergence--------
-----RED Dot(9ema Crossover) with Red Line: Bearish
-----Rejection of 200ma on Daily Time Frame
#Follow for daily stock, crypto and forex technical analysis.
⚠️ Trading is risky, and I understand nothing is guaranteed. Proper risk management should be in place at all times to minimize losses. Please consult a financial advisor before trading. All Inclusive Trading LLC is not a financial advisor and may not be held liable for any losses which may occur.

$spy $iwm could it be like this? Bear Market RallyYou better hope not. watch out below. Could take a long to to BEAR out LOL

A bigger upside helps smallcapsCloser support and higher upside target give Russel stocks a chance to bounce faster than the heavy weighted SPY and QQQ

Opening (Margin): IWM September 30th 178 Short Put... for a 1.80 credit.
Comments: Not a great place or a great IV environment to be doing this, but looking to offset some of my IWM short delta. Previously, I did a covered call, but I don't need that much long delta here at the moment, so am doing a lower delta out-of-the-money short put and will add at intervals if necessary. Delta/theta 15.18/5.

Closed (IRA): IWM September 2nd 196 Covered Call... for a 191.42 credit.
Comments: (Late Post). Paid 187.73 to put this on. (See Post Below). Money, take, run today. 3.69 ($369) winner. Will look to re-up in the next couple of days, as I still have IWM short delta on.


Bearish on Russell 2000 ETF. IWMGoals 0.56, 0.49. Invalidation at 0.89.
We are not in the business of getting every prediction right, no one ever does and that is not the aim of the game. The Fibonacci targets are highlighted in purple with invalidation in red. Fibonacci goals, it is prudent to suggest, are nothing more than mere fractally evident and therefore statistically likely levels that the market will go to. Having said that, the market will always do what it wants and always has a mind of its own. Therefore, none of this is financial advice, so do your own research and rely only on your own analysis. Trading is a true one man sport. Good luck out there and stay safe

$IWM / $SPYSmall-Caps outperformance of Large Caps is one of the requirements of a true market bottom (on a relative basis). This favors growth over value.
Small Caps > Large Caps

Another false breakout for the Russell 2000?The Russell 2000 has been prone to false breakouts since last fall as the index rallied to all time highs then failed at the end of 2021. The move from Monday/Tuesday of this week could set up the same fate for the index especially if the highly anticipated #CPI data comes in hotter than expected. You can also see that the November 2021, March 2022 and highs this week marked a turn in RSI as well. Tomorrow's data should have a strong impact on the index.

IWN RUSSELL Uptrending LONG IWN
This Russell ETF is consistently uptrending above the cloud indicator.
Uptrend is validated by relative volume increasing.
Target is the long term volume profile POC about 5% upside.
Good for stock or option play.
See also QRU22 futures chart.
