IWMThe set up from LT support off the bottom channel has Nuked (of course) and I say that b c this year is the year where everything looks like a perfect set up that just nukes. (except oil trades) At this point IWM can still be an over throw, if small caps are pricing in all this inflation & War in Ukraine & recession talk. If the chart is to follow NQ then we have much more pain ahead. Looking at OTC stocks I am really unsure as to how much more pain can be endured. They all seem pretty bottomed. So watching for an MM overthrow here and confirmation would be working the candle sticks back into the LT channel IMO.
IWM trade ideas

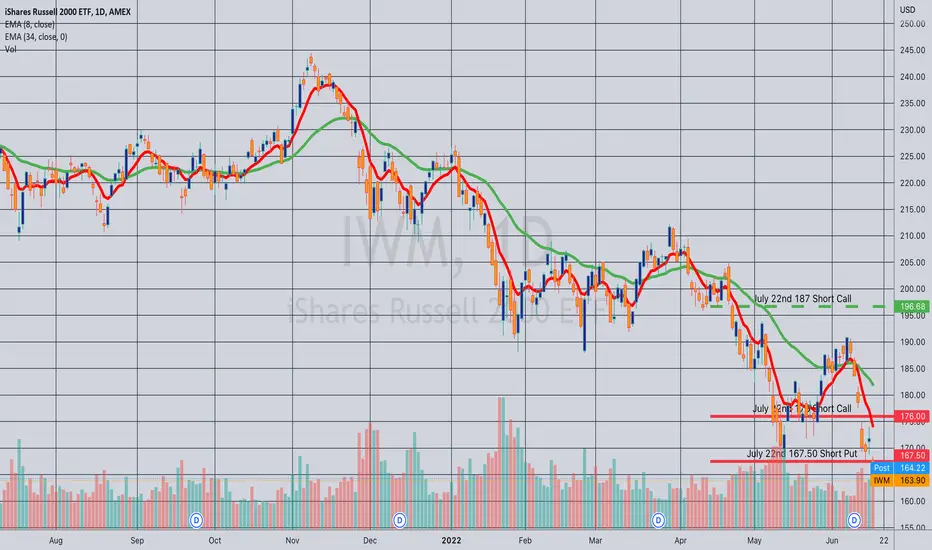
Rolled: IWM July 22nd 176 Short Call to 172... for a 1.35 credit.
Comments: Rolling down the untested side of my July 22nd short strangle, the short put leg of which is at the 167.5. Total credits collected of 8.39. End of day delta/theta 7.48/19.31.

$IWM Analysis, Key Levels, and Targets$IWM Analysis, Key Levels, and Targets
I’m calling bottom here…
—-
I am not your financial advisor. Watch my setups first before you jump in… My trade set ups work very well and they are for my personal reference and if you decide to trade them you do so at your own risk. I will gladly answer questions to the best of my knowledge but ultimately the risk is on you. I will update targets as needed.
GL and happy trading.
IF you need anything analyzed Technically just comment with the Ticker and I’ll do it as soon as possible…

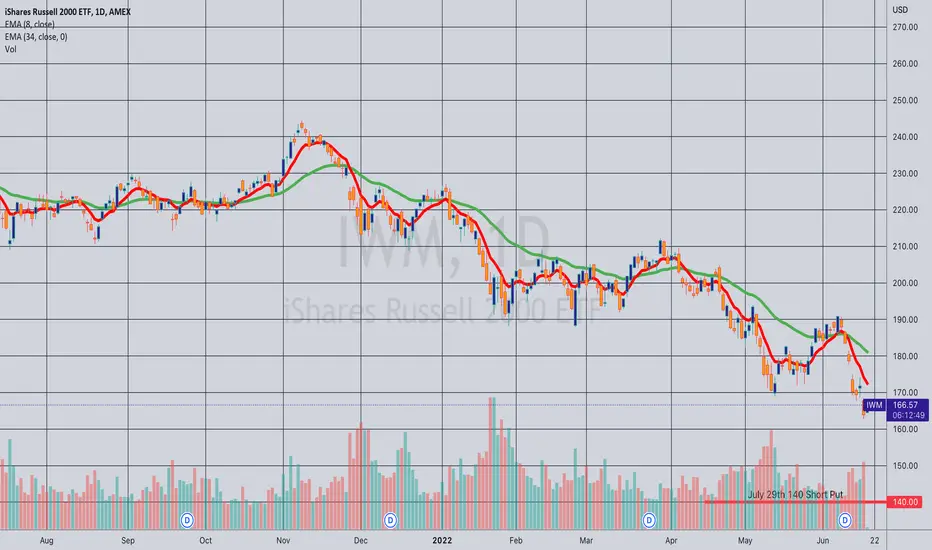
Opening (IRA): IWM July 29th 140 Short Put... for a 1.49 credit.
Comments: Targeting the <16 delta strike paying around 1% of the strike price in credit in the expiry nearest 45 days to emulate dollar cost averaging into the broad market.
Rolled: IWM July 22nd 187 Short Call to 176... for a 1.89 credit.
Comments: Rolling down the untested side ... . Total credits collected of 7.04 with 160.46/183.04 break evens. With delta/theta at 29.47/16.08, the setup could benefit from a bounce ... .
iwm gap filled , first index to retrace to pre-covid highsseems like this thing should begin to stabilize as other indexes complete their selling...we'll see

Russell ready to rally✔️Gap has been filled from November 2020.
✔️Bullish divergence on multiple time frames (4H, daily, and weekly)
✔️Put/Call ratio over 1.2
Looking to run to $178.

$IWM — Gap Fill Very high chance of this gap - at $165 - filling to the downside.
It's just a matter of when - not if.
Very possible that we see zig-zagging A B C D patterns to the downside before it fills - I don't think we will waterfall down to that level.

170 and 140 are critical support for IWMPay attention to price action around the 170 and 140 price range, these are the major supports I see.

Opened (IRA): IWM July 29th 145 Short Put... for a 1.91 credit.
Comments: Targeting the <16 delta strike paying around 1% of the strike price in credit in the expiry nearest 45 DTE.

Rolled: IWM July 22nd 197.5 Short Call to the 187... for a 1.40 credit.
Comments: Rolling down the untested side of my July 22nd short strangle. Total credits collected of 5.20. Delta/theta 23.62/15.41.

Buying the FibHad to step up at the end and buy some based solely on it's hit on the 50% fib correction. David Halsey wrote a book called Trading the Measured Move. Generally directed for short term traders with short term moves, I'm still applying the concept that stocks will retrace 50% of the move and then rally to the .236 fib. Worth a shot with blood in the street today. No one on the market news has had one positive thing to say, preparing everyone for lots more down to come. Worth a shot for obviously, a long term position.k

IWM pivot points and volume by price areasIWM pivot points and volume by price areas. Red lines indicate pivot points. Purple lines are volume by price areas. Yellow lines (if present) are weekly price gaps.

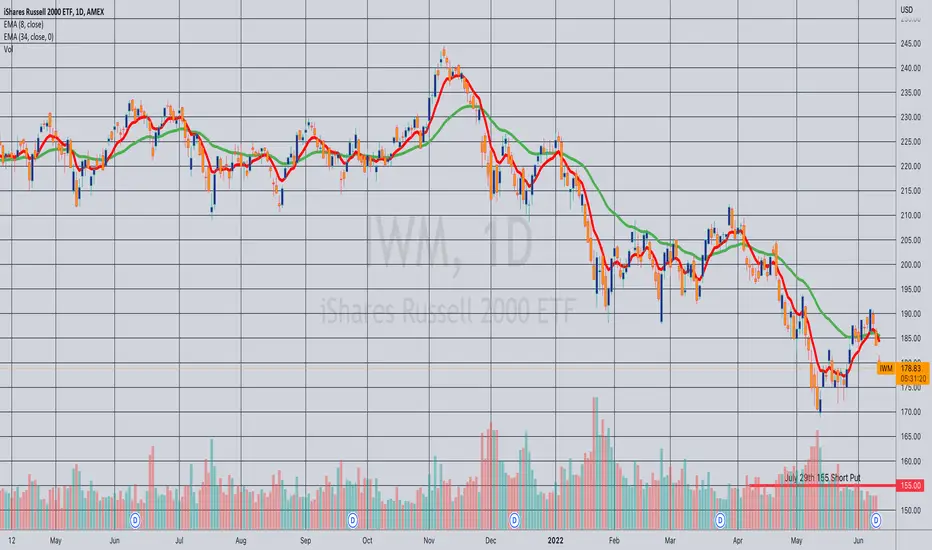
Opening (IRA): IWM July 29th 155 Short Put... for a 1.61 credit.
Comments: Targeting the <16 strike in the expiry nearest 45 days paying around 1% of the strike price in credit to emulate dollar cost averaging into the broad market. Still have July 1st, July 8th, and July 22nd rungs on.
Rolling: IWM July 22nd 202 Short Call to 197.5... for a .93 credit.
Comments: Rolling in the untested side of my July 22nd short strangle to maintain a <1.0 delta/theta ratio. Total credits collected of 3.80.

Russell 2000 Bear Trend
Well.
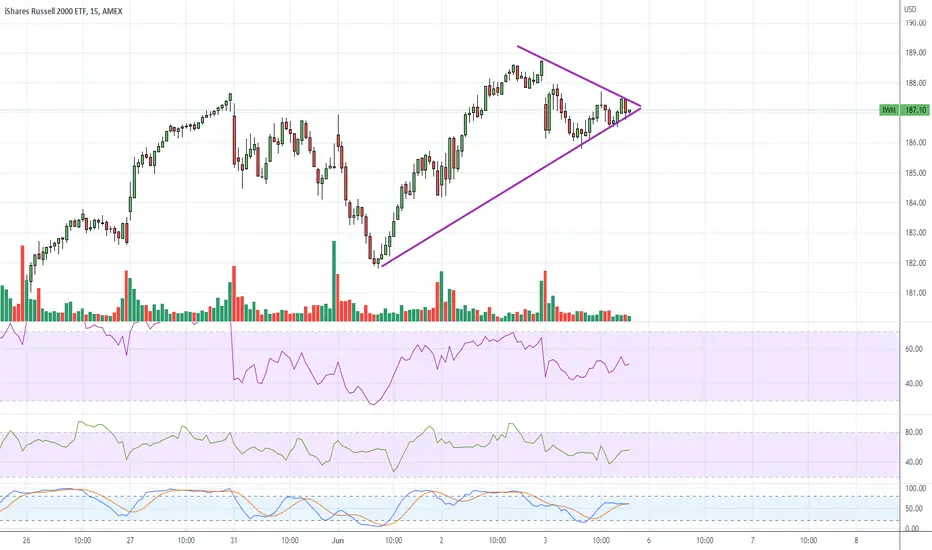
1) Macro bullish symmetrical triangle fakeout leading to top signal.
2) Low volume on bullish break, High volume on reversal confirming fakeout.
3) Omicron Variant market reaction =~= Covid-19 market reaction
See SPY fakeout before March 2020 Covid-19 crash. (right)
Lastly, see bearish divergence between index and % of stocks above 200 ma (orange).

several ways to end this weekim imagining if we touch these levels where the paths are we will exhibit the following patterns friday- monday

Opened: IWM July 22nd 167.5/202 Short Strangle... for a 3.18 credit.
Comments: These WERE 16 delta strikes on both sides when I opened this using my phone app at around 9:45 CST. In any event, 3.18 credit on BPE of 21.00; 15.1% ROC at max as a function of BPE; 7.6% at 50% max. Will look to adjust sides on side test/approaching worthless or a delta/theta ratio >1.0. (The ratio is currently 5.97/10.48 or .57).

Opened (IRA): IWM July 22nd 162 Short Put... for a 1.65 credit.
Comments: Did some in the Q's, some in SPY ... . Figured that I might as well go for the trifecta. Targeted the <16 delta strike in the expiry nearest 45 days' duration paying around 1% of the strike price in credit to emulate dollar cost averaging into the broad market.
Will look at net delta tomorrow and determine whether I need to adjust my hedges to keep net delta "happy."

Rolled (IRA): IWM June 17th 179 Short Put to July 22nd 169... for a 1.03 credit.
Comments: Mechanically rolling out at 50% max to the <16 delta strike paying around 1% of the strike price in credit in the expiry nearest 45 days. Total credits collected of 3.76 (See Post Below) plus the 1.03 here for a total of 4.79 relative to the July 22nd 169 short put value of around 1.80, so I've realized gains of 2.99 ($299) so far.
Doing this reduces risk not only because the strike is lower, but also because I collected a credit to do it, reducing my cost basis even further.

$IWM Analysis, Key Levels, and Targets$IWM Analysis, Key Levels, and Targets
I do not have a position at this time, but here are some levels that I’m watching…. Any pull back near the dotted light blue line and I’m buying ITM calls… anything above 205 (maybe even 200) and I’ll buying ITM puts….
Have fun, y’all…
—-
I am not your financial advisor. Watch my setups first before you jump in… My trade set ups work very well and they are for my personal reference and if you decide to trade them you do so at your own risk. I will gladly answer questions to the best of my knowledge but ultimately the risk is on you. I will update targets as needed.
GL and happy trading.
IF you need anything analyzed Technically just comment with the Ticker and I’ll do it as soon as possible…

Harami cross for the $IWMThe small caps had an impressive rally this week. On Friday, amid general weakness in the markets, the $IWM posted a harami cross. From a technical analysis perspective, this candlestick is a warning sign for a possible reversal. However, in order to get bearish on this sector, we would need to see some continuation to the downside early next week. For now, all that this candle tells us is that the market is somewhat indecisive. We are going from bullish to neutral into next week with regards to the $IWM.

Indices forming an intraday pennantAppears to be an intraday pennant on the 4 major indices (SPX, NDX, DJI, Small Caps). Could go either way either way Monday.
I just have some PTON puts because it's total garbage, but even garbage will float on a rising tide. just a small play.
In any case, I don;t expect the market to do anything in the last hour, but we'll see. My futures indicators are still trending bearish.