6/1/22 IWMiShares Russell 2000 ETF ( AMEX:IWM )
Sector: Miscellaneous (Investment Trusts.Mutual Funds)
Market Capitalization: $$--
Current Price: $184.26
Breakout price: $187.85
Buy Zone (Top/Bottom Range): $183.95-$168.15
Price Target: $189.60-$204.00 (1st), $249.20-$278.80 (2nd)
Estimated Duration to Target: 172-180d, 412-422d
Contract of Interest: $IWM 12/16/22 200c, $IWM 6/16/23 210c
Trade price as of publish date: $7.86/contract, $9.41/contract
IWM trade ideas

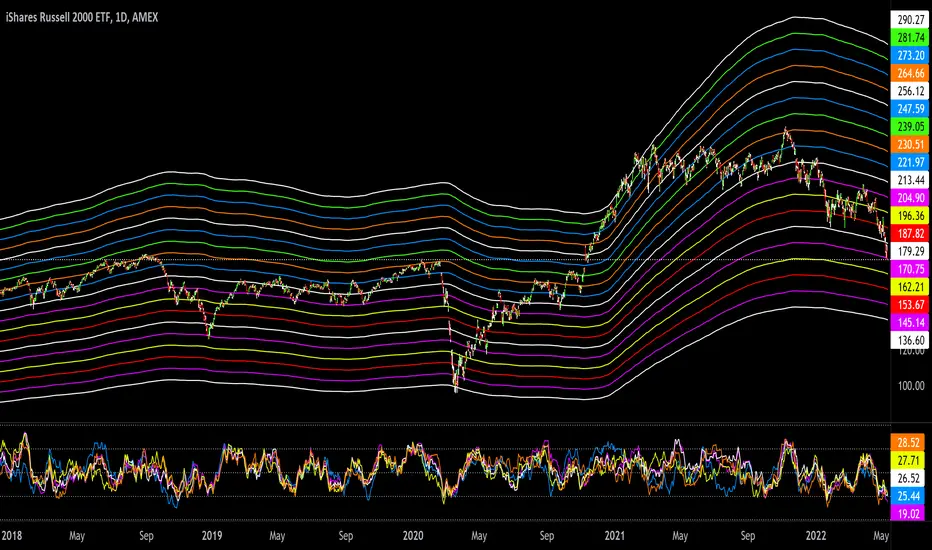
Where are we IWM?Where are we IWM? Here's a Mega Triangular Trend Channel MTTC2.0 (beta) set to 200SMA with 19 levels. And my tickerTracker MFI Oscillator set to 20 with SPY, VTI, QQQ, IWM & DIA.
Do your own due diligence, your risk is 100% your responsibility. This is for educational and entertainment purposes only. You win some or you learn some. Consider being charitable with some of your profit to help humankind. Good luck and happy trading friends...
*3x lucky 7s of trading*
7pt Trading compass:
Price action, entry/exit
Volume average/direction
Trend, patterns, momentum
Newsworthy current events
Revenue
Earnings
Balance sheet
7 Common mistakes:
+5% portfolio trades, capital risk management
Beware of analyst's motives
Emotions & Opinions
FOMO : bad timing, the market is ruthless, be shrewd
Lack of planning & discipline
Forgetting restraint
Obdurate repetitive errors, no adaptation
7 Important tools:
Trading View app!, Brokerage UI
Accurate indicators & settings
Wide screen monitor/s
Trading log (pencil & graph paper)
Big, organized desk
Reading books, playing chess
Sorted watch-list
Checkout my indicators:
Fibonacci VIP - volume
Fibonacci MA7 - price
pi RSI - trend momentum
TTC - trend channel
AlertiT - notification
tickerTracker - MFI Oscillator
www.tradingview.com
Rolling: IWM July 1st 158 Short Put to July 1st 173... for a 1.64 credit.
Comments: Rolling up the short put aspect of my July 1st IWM short strangle, the short call of which is at the 194 to cut the delta/theta ratio to around 1:1. Total credits collected of 6.33.
It's now delta/theta -12.03/14.85.

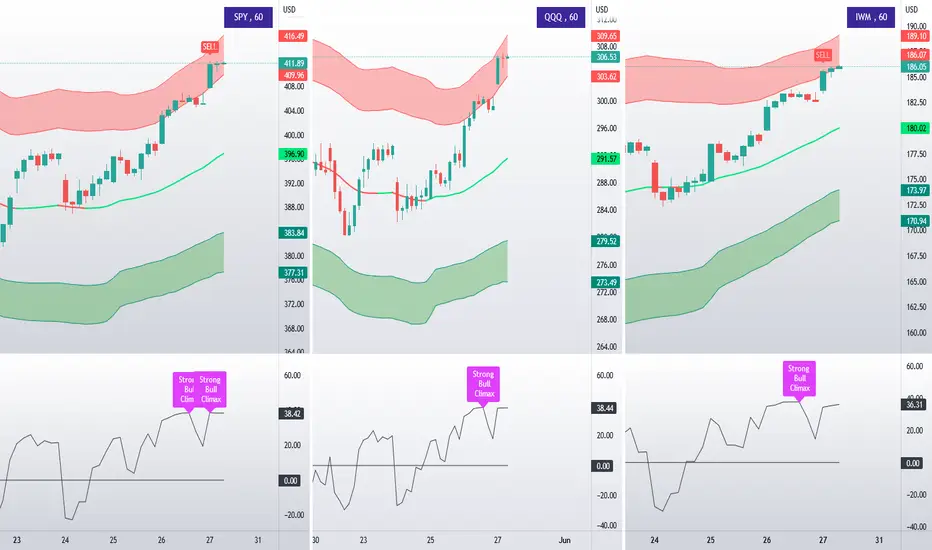
Bulls look tired, they pushed SPY, QQQ, IWM into the supply zoneSPY, QQQ, IWM printed buying exhaustion signals
I expect to get a pullback next week
Rolling (IRA): IWM July 1st 154 Short Put to July 8th 164... for a 1.04 credit.
Comments: With the July 1st 154 at greater than 50% max, rolling it out to the <16 delta strike in the expiry nearest 45 days paying at least 1% of the strike price in credit. Total credits collected of 1.64 (See Post Below) plus the 1.04 here, for a total of 2.68.


Swing long IWM 175.26Daily stoch heading up also making higher lows
Vol stink tight trailing stop
Weekly on bottom sideways
target is 185

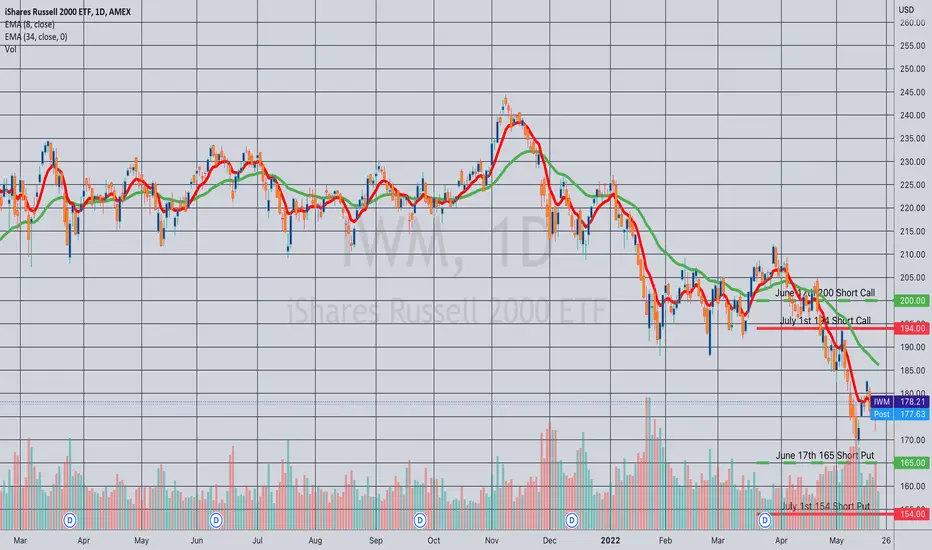
Rolled: IWM June 17th 165/200 Short Strangle to July 1st 158/194... for a .90 credit.
Comments: Locking in some realized gain here on this little bounce, recentering side risk, and receiving a credit all at the same time. I rolled both sides to the 16 delta strikes, so that the position is back to delta neutral.
Total credits received of 4.69, relative to a current short strangle price for the July 1st 158/194 of 3.28, so I'm up 1.41 ($141) on the position.
Another Straight Forward Trade DIA and IWM are both pretty under-rated stocks to day trade.
IWM is actually slightly better than DIA because it has similar options liquidity and expiries to SPY.
IWM is set up really nicely for either a swing short or intra-day short plays.
We have IWM confined to a downtrend for the past little while. And while SPY and DIA were somewhat able to break out of their downtrend, only to come crashing back down today, IWM has pretty much remained within this channel.
On the 1 hour we see it set up pretty nicely. We also see a nice little bear flag.
I mean this doesn't need much more analysis, its pretty straight forward.
Based on math projections, we can expect to break at least to but likely below 173.75 tomorrow.
If you want to swing for a bit of a larger gain, I would actually say IWM is set up okay for that as well. Conservatively I would set your first target to 170.
Just my thoughts and what I'm seeing!
Trade safe everyone!

Opening (IRA): IWM July 1st 154 Short Put... for a 1.64 credit.
Comments: Keeping on keeping on ... . I don't have much IWM on, so am selling something new in the July 1st expiry, targeting the <16 delta strike that is paying at least 1% of the strike price in credit to emulate dollar cost averaging into the broad market.

Rolling (IRA): IWM May 27th 183 Short Put to July 1st 179... for a 1.72 credit.
Comments: Staying mechanical and rolling to the strike nearest 45 days until expiry for a credit that is about 1% of the strike price. Total credits collected of 8.54. Although it's in-the-money, my cost basis is now the short put strike (179) minus total credits collected (8.54) or 170.46 relative to where it's currently trading at 176.40.

Rolled: IWM June 17th 210 Short Call to 200 ... for a .56 credit.
Comments: Although the 165 hasn't been tested, the 210 is converging on worthless, so rolled it down a smidge. Total credits collected of 3.79.

IWM - P5 arrived? If so, we bounce!The #IWM has traded in a wonderful way.
Watch how the #Medianlines , the whole #Pitchfork provided support, resistance and - if you know the rules, how they could be applied to make some $s.
However, we arrived on the P5, which is potentially morphing to P0 for the next move to the upside. Alltough I personally don't believe it because of this market environment, chances are high.
...can you hear the emotions nagging on me to un-follow the rules? §8-)
If we open next week below the L-MLH, we would trade further down to the WL (Warning Line).
As far as my trades are designed, I risk tiny and try to let them run by following the rules and Money-Managent.
#iwm #medianline

IWM - Russel's next haltGiven the nice turn at the Center Line, we have a new target for the IWM: L-MLH...at least IMO.
The yellow pitchfork is here to see, if the ongoing flow, the direction will change, and if the momentum is increasing or not.
If not, price will trade outside the U-MLH. Otherwise we will see a fast and hard drop.

$IWM Russel 2000 holding key levelFeb 2020 resistance highs which preceded the March covid crash seems to have turned into support for now. Change of polarity or too early too call? We have also reversed and turned above the 200dma
Interesting technical level to monitor

Small Caps are dirt cheapThese types of mean reversion trades can be very strong because capital likes to move back and forth between sectors in a cyclical way. It seems like the current trend is to sell off small caps to buy large caps, but it could easily be that the trend in 2023 shifts back to selling large caps and buying small caps, so it makes more sense to have higher exposure to small caps.


Consumer Sentiment, Inflation and Market CrashWhat is the UMCSI Showing to us?
The US economy is deteriorating further. After the Virus the sentiment recovered slowly and peaked with Biden taking office in expectations of better times ahead. At the same time inflation kicked in due to massive overspending. Inflation is always a monetary problem of too much money in circulation. Even fiscal policies (“Free money” programs) are rooted in monetary policies. If the government ask for money nobody has at hand, the FEDS issue debt and create the liquidity needed to pay for those programs. This is important to understand. They create money out of free air.
Follow GDP NOW from the Atlanta Feds and we will see how growth is constantly fading away. Will we have a second quarter in the red?
GDP Outlook.
The UMCSI is at its lowest level since the virus was released, which was the lowest ever since, even under Bush, Obama and Trump. We also had the first Quarter of the GDP coming in negative this year. Two in a row makes it officially a recession.
And Stocks?
We also see that the S&P 500, NASDAQ, Russel 2000 are about to hit 20% below the most recent high. A 20% correction will be seen as a recession in the broad market. Why? Because earnings of the underlaying companies will come in lower than they used to do. Also, the higher the stock price gets the more is expected for their growth. Relatively to their value the stock has to grow more to produce the same ROC. Otherwise the EPS (Earnings Per Share) will slump and investors will look for other opportunities. This makes the stock market less attractive the more it grows. Other investments are also less risky. And, i.e., about 50% of the IWM, Russel 2000, cannot serve their debts!!
The Party is over my Friends.
Follow me on Twitter, this post with images is pinned for a while!

IWMSmall caps looking pretty bottomed here IMO.
Let's see with NQ bouncing off 200 weekly EMA & SP500 looking ready to push of the 3850 lvl wall street may want some extra risky trading till EOY.

IWM correction in progress ...entering B wave ? probably soon ... if so this would be a possible roadmap for the next couple of years

IWM Update: 15 MayThe Russell has rallied higher in the last two sessions. In this video I take a look at two Elliott wave counts to determine if the correction is complete - or if we should expect further selloffs.

