Bullish? Lately, IWM has been somewhat following the broader market, like SPY, DIA and QQQ.
In fact, IWM took a harder hit than SPY in the sell off we saw. It sold off below 20% vs SPY that only sold off roughly 13%. SPY is definitely more averse to such dramatic sell-offs.
And while SPY flounders with extreme ups and downs in its price action, IWM has remained quite consistent and has been an attractive option for those escaping the huge volatility of SPY.
In fact, its created these very consistent channels where you can essentially go long or short and be sure to hit that price target within a week, regardless of the greater circumstances. Ideal for those applying martingale type strategies and those relying on the cyclic nature of the market (see the channels below):
In fact, because of this consistency, IWM responds very well to statistical predictions (my personal strategy) and, I admit, I have neglected this stock in favour of DIA. But I find DIA also is becoming slightly less predictable just like SPY, as SPY has started to flail its arms around and desperately clasp to the walls to keep itself afloat. As SPY continues to show dramatic swings in both directions, IWM has remained fairly predictable and stable and it actually looks somewhat bullish.
We see a cup and handle pattern forming on the 1 hour chart (see below):
Not only that, but we actually have a well defined bull flag that broke out and has maintained its breakout level (see below):
This definitely looks bullish on the 1 hour. I admit, its really hard to be bullish in this current market and especially given the current economic and political circumstances of the world. Its also hard to expect IWM to be bullish and SPY not to be.
But I don't necessarily think that this bullishness will neither be long term nor sustained. I just think that, in the short term, we could see some bullishness.
IWM has fallen dramatically. It is trading in its predicted normal range right now from a mathematical perspective. In any other given circumstance, this would be an ideal opportunity to go long. However, I think that we will see, eventually, this market is going to tank things down into the negative growth. SPY has not even been able to recover to its normal range yet. Its still operating at its inflated range. And until it finally gets the reality check it needs, we can bet that that beast is going to drag everything down eventually. I think its completely unfair that stocks like IWM, QQQ and DIA, which have normalized already, will pay the price for SPY's "pig whale"ness, but yeah, c'est le marché boursier.
I should add, that its very clear in the first chart that the lower channel is a pseudo-wedge type bearish flag. Its definitely a bearish sign, but we still have not had a breakout of this channel, YET.
Tomorrow, what I have calculated for IWM is the following:
High: 203.97, If we do get that bullish conviciton, we could see a breakout to the high 204 range. Anything higher than 204 would be serious bullish conviction.
Low: 201 range. If it maintains bullishness, we may only see high 202s.
My plan for IWM?
- Looking for some short term bullishness. Ideal situation is if this drops down near open to 202 / 201 range for a long entry.
- If this hits the ground running, I will likely be looking for rejection of the higher 203 range. Stop out would be above 204 range for a short entry (But this is contingent on what the model predicts based on AM data).
Based on technical analysis of these channels as well as probability calculations, ideal entries for a swing short position are over 207/208 price.
Ideal entries for a swing long position is 197 or below.
Not financial advice, just haven't done a true technical/math based analysis in a while and wanted to share what I was seeing on IWM.
Feel free to leave your thoughts and questions below.
Thanks for reading!
IWM trade ideas

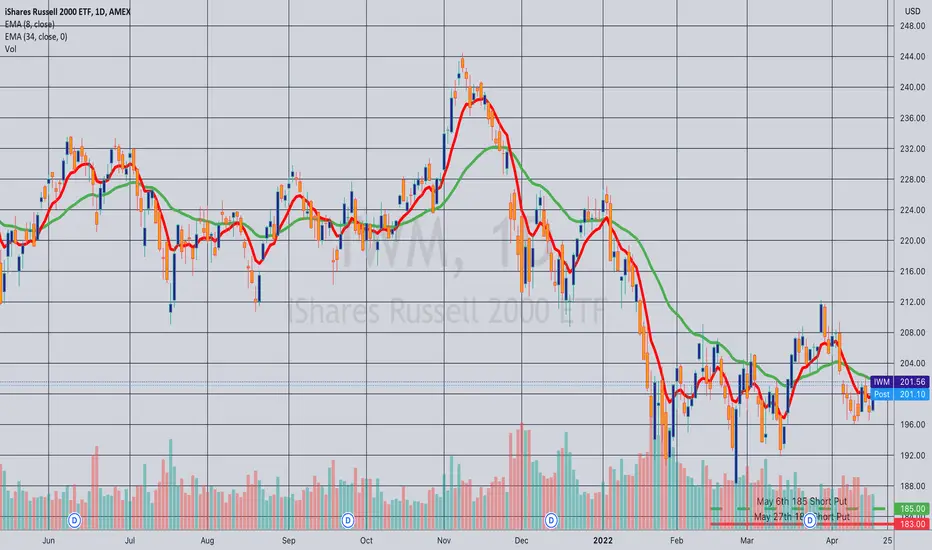
Rolled (IRA): IWM May 6th 185 Short Put to May 27th 183... for a 1.05 credit.
Comments: 50% max roll to the <16 delta strike in the expiry nearest 45 days that is paying around 1% of the strike price in credit. Total credits collected of 5.77 (See Post below) plus the 1.05 here for a total of 6.82 versus the 1.86 or so the 183 was paying, so I've realized gains of 4.96 ($496) so far.
The May 27th 16 delta is just barely paying 1%; otherwise, I probably would have done a "window dressing roll" from the 185 to the May 27th 175 for a small credit to milk the remaining extrinsic out of the option while reducing risk (since it's farther out-of-the-money) and buying power effect (since it would've been a lower strike).
$IWM Key Levels, Analysis, & Targets $IWM Key Levels, Analysis, & Targets
So today with Vix up over 5% (up to 7, but I rolled around 5.5%) I took advantage and rolled my Long puts up to 203, and my short puts up to 193, making my strikes a little wider and setting up to collect more premium when vix goes back up.
My long strikes are still ITM, and the short strikes are a little further down.
And sell target is still 184…
—-
I am not your financial advisor. Watch my setups first before you jump in… My trade set ups work very well and they are for my personal reference and if you decide to trade them you do so at your own risk. I will gladly answer questions to the best of my knowledge but ultimately the risk is on you. I will update targets as needed.
GL and happy trading.
IF you need anything analyzed Technically just comment with the Ticker and I’ll do it as soon as possible…

$IWM Key Levels, Analysis, & Targets $IWM Key Levels, Analysis, & Targets
So I haven’t traded IWM in a while, so my strikes are kind of close together…
Right now I’m in puts
Long 200, Short 196 on the 17 June expiration.
As soon as either side get’s challenged I’ll adjust. And when the opportunity presents itself I’m going to leg into the call side as well…
-----
---
On the Put side:
When VIX goes up, roll long puts down and short puts up to collect premium.
When VIX goes down, roll short puts down and long puts up, to strengthen your position.
On the Call side:
When VIX goes down roll long calls up and short calls down to collect premium.
When VIX goes up roll long calls down and short calls up to strengthen your position.
—-
I am not your financial advisor. Watch my setups first before you jump in… My trade set ups work very well and they are for my personal reference and if you decide to trade them you do so at your own risk. I will gladly answer questions to the best of my knowledge but ultimately the risk is on you. I will update targets as needed.
GL and happy trading.
IF you need anything analyzed Technically just comment with the Ticker and I’ll do it as soon as possible…

iShares Russell 2000 short...Hi! this analasys is about shorting ETF. As you can see at chart, we see the trend is broken and 20SMA, 50SMA and 200SMA is crossed. In same time we have bearish flag pattern and i am waiting for to break lower trendline of flag pattern. My TP is 171.00 and SL is 209.46.
Note: DISCLAIMER!
Please do not use this information to make investment decision!
This is only for educational purposes.

IWMwe notice tha tthe price reachd a support level few days ago and broke it . but a new climb is being form as the the price slowly going back to the previos support that've been broke .
best move : is to wait until we see a confirmation candle is formed and open postion as buyers

$IWM Small Cap Slaughter is Underway..Short to Demand or Discount Zone. Long off Demand or Discount Zone back to Supply. Nuff' Said.

WYCKOFF DISTRIBUTION ENDING IWM Phase E depicts the unfolding of the downtrend; the stock leaves the TR and supply is in control. Once TR support is broken on a major SOW, this breakdown is often tested with a rally that fails at or near support. This also represents a high-probability opportunity to sell short.

Opening (IRA): IWM May 20th 180 Short Put... for a 1.90 credit.
Comments: Targeting the <16 delta in the expiry nearest 45 days until expiry paying at least 1% of the strike price in credit to emulate dollar cost averaging into the broad market.

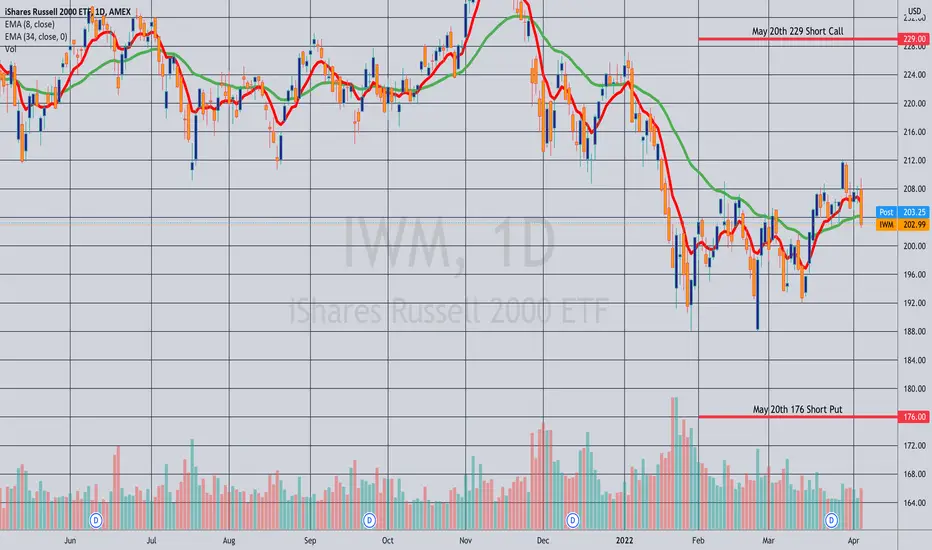
Rolled: IWM May 20th 229 Short Call to the 217... for a .78 credit.
Comments: Flattening net delta of my short strangle on this down move. Total credits collected of 1.97. Resulting setup is the May 20th 176/217 with delta/theta of -.52/8.36.

Opened: IWM May 20th 176/229 Short Strangle... for a 1.19 credit.
Comments: A bit of an experiment here, selling the 90 day duration 2 x expected move strikes in shorter duration. Using the June 30th expiry (86 days) as the basis for this setup, I looked at the strikes nearest the 16 delta in that duration, and then sold premium in those same strikes in the expiry nearest 45 days. The benefit is a higher probability of profit setup, with the trade-off being less credit received.
I'll look to manage it, however, like any other short strangle -- rolling in untested sides, taking profit at 50% max and/or rolling to a delta neutral setup in longer duration for a realized gain and a credit.
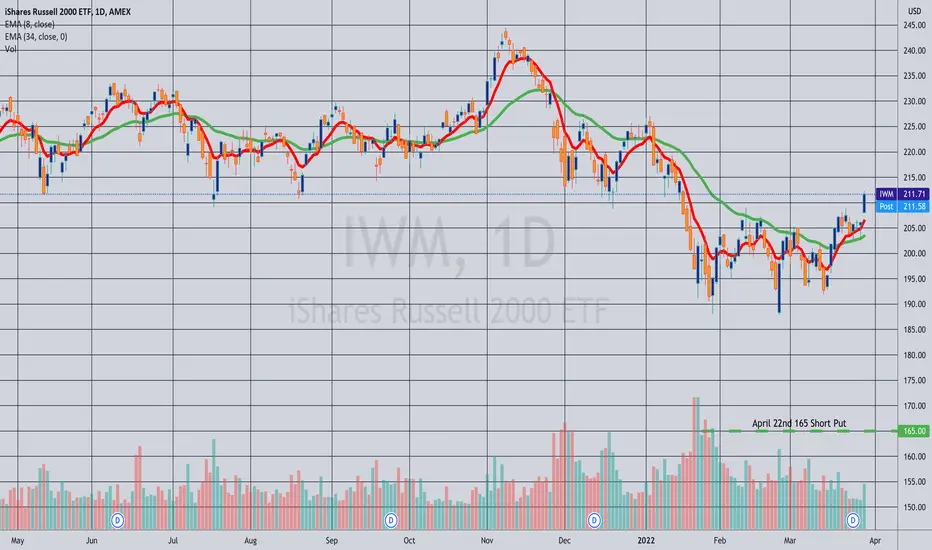
Closing (IRA): IWM April 29th 170 Short Put... for a .28 debit.
Comments: Cleaning up April. Collected a total of 5.63 in credits with rolls. (See Post Below). Closing out here results in total realized gains of 5.35 ($535).

Another IWM false breakout?The Russell 2000 tricked longs back in the fall of 2021 and that "false breakout" led us to a breakdown.
Once again, the break back above the 209.50 level this week may have led to another "false breakout." Can we see a move to the 188.00 level and beyond?
I think bulls have something to think above. Fool me once.

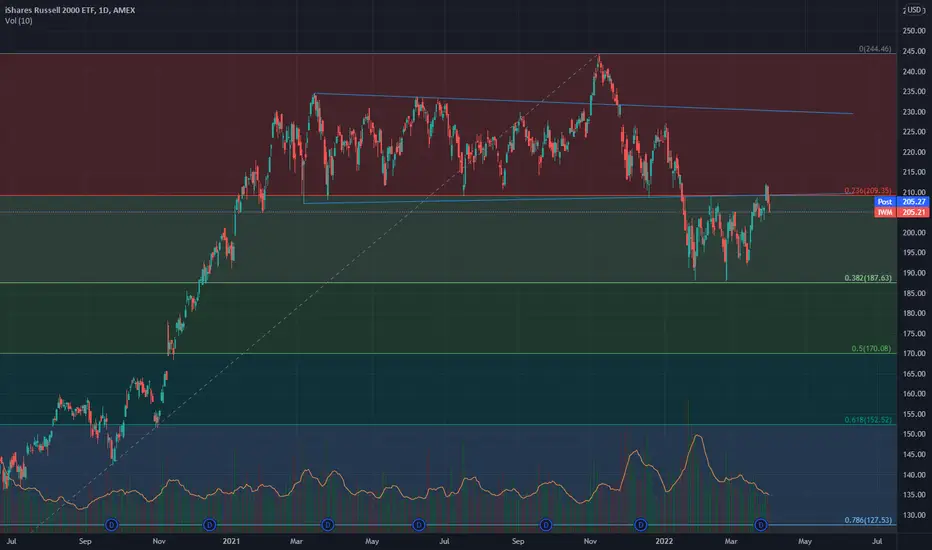
Perfect Retracement for Small Cap Index The Russell 2000 index $IWM retraced and bounced perfectly off the 38% fibonacci level. Actually it bounced twice, which created a double bottom at the 38% retracement level. This strong level of support suggests the bottom may be in and small caps may start to lead the market up again.
IWM 191/186 Put Credit Spread - Apr 29thPut Credit Spread
Strikes: 191 short / 186 long
Credit received: 0.51
Max loss = 5.00-0.51 = $449
Hey Everybody! I have not posted a new trade idea since march 10th, due to a combination of life being busy (part time trader) and the fact that I really wasn't sure where to place my trades with current market conditions. Unfortunately this has lead to my portfolio having 0 positions, so I have been itching to get a position on to generate some returns. Might not be the best solution, but a small position to keep me interested won't hurt that much if it goes against me.
Rationale for this trade:
1. IWM seems to have found another range here from 192 to 209. I like to play these ranges when I can enter into a position that meets return requirements (10% Return on margin) and also provides a significant margin of error or entry point. In this case, the short leg at 191 puts me just outside this range, and paid enough to enter the trade.
Trade Management:
My normal rule is -200% of credit received stoploss or 50% take profit, given that we are currently at the top of this range, if we move back down towards my strike I will likely take this off earlier and look to reset once we show signs of upwards strength.

Closed (IRA): SPY April 14th 391 Short Put... for a .20 debit.
Comments: More taking off stuff approaching worthless on this volatility contraction/rip. Collected a total of 6.40 in credits with rolls. (See Post Below). Closing out here results in total realized gains of 6.20 ($620).

Closed (IRA): IWM April 14th 165 Short Put... for a .20 debit.
Comments: Cleaning up stuff that is approaching worthless ... . Opened for a 1.73/contract credit. (See Post Below). Closing out here results in a profit of 1.53 ($153)/contract. Still left with the April 29th and May 6th "rungs."
iwm watchin the chicklets for targetswatching the vwaps for target/ price chickelts.
and of course fib .618

IWM: Weakness PrevailingIWM Looking like will lead us to the downside this week. The weakness comes at the top of the macro bear flag we cover in depth here. We post videos every Sunday to get your week ready!

Russel2000According to the Russel2000 index, I change my idea to the opposite one. The index cannot overcome the resistance level, which has served as a support level for it for more than a year. A flat is formed, which in this case serves as a pattern to continue the downtrend. The target level for moving down is the level of $160. The fall will not be fast.

Russel2000, RTY, IWMThe Small Cap Index has been erratic over the past year. I will assume its movement, as indicated in the attached forecast, with the target of growth until the end of the year up to a value of 270.

Russel2000, Small CapsShort-term forecast for Russel2000, relevant mainly for small caps companies. The index, starting in September 2020, bounced off the support level of 2100 several times, and on December 20 of this year found itself in the superpoint zone, from where it went up strongly yesterday. Growth is expected to target up to 2500, up to the support level of the sloping resistance. Having reached this target, the index will behave like the S&P500, as indicated in the previous forecast - it will begin a correction.
In terms of growth, we fit into Santa Rally - that is, the beginning of January, which is in good agreement with the previous forecast for the S&P500. You can short-term reject patterns in long at small caps, or unload positions that you do not like, since the bulk of the companies that make up this index are unprofitable.
I do not recommend accumulating short positions on this movement, they will probably try to endure it.

Closing (IRA): IWM April 14th 160 Short PUt... for a .13 debit.
Comments: Opened for 1.73, (See Post Below); closing it out here for a 1.60 ($160) profit. Still have April 22nd, April 29th, and May 6th rungs on which I'll either close or roll out as I get to them from a duration standpoint.
