JPMorgan Falls Thru Trap-Door Equivalent to Pre-COVID HighsNot much of an explanation needed here... financials have been struggling, and JPM right along with them. What's notable here is that price has fallen below the pre-COVID highs, which means that all recapture, plus growth obtained prior to COVID, has all be vanished for stockholders of the mega-bank.
Written & Annotated for the CMT Association.
Adam D. Koós, CFP®, CMT, CEPA
President / Sr. Financial Advisor / Portfolio Manager
Libertas Wealth Management Group, Inc.
JPM trade ideas

JPM forming a descending channel?After ERs price made a below longterm support and it now can retest it as resistance.
I am watching price action to see if we can form a new descending channel.

JPM .50 FIB and 200 MA = BuyJP Morgan is a buy. 200 day moving average, .5 fib, while FED raising rates.

$JPM with a Bearish outlook following its earnings #Stocks The PEAD projected a Bearish outlook for $JPM after a Negative Under reaction following its earnings release placing the stock in drift D with an expected accuracy of 60%.
BUY BUY BUY JPMHello everyone, we are gonna see this hit $220 by 2023. BUY every time it hits a low a good price to buy in at is 110.65
I have a course on the best indicator set up.
Comment below to sign up. And thanks for reading.
Made thus short now go make some bread!!

$JPM weekly charthere is the current channel JPM is playing inside of. laid out some weekly levels to consider and watch for support and resistance reversals.

Bank earnings, winners & losersBank earnings are starting on Wednesday 4/13. Banks have been weak so far this year. In my opinion, Institutional investors are value trapped and hoping to make yield by selling options into earnings IV. Bank earnings guidance can be an important economic indicator for other stocks. Since bank earnings are the first to kick off the earnings season, they will reveal important economic insights that can directly or indirectly affect other stocks. Here's a 16 ticker list of the winners & losers for 2022 YTD and their earnings dates. Also, I have my Signal Blender beta (SigBlendbeta) indicator with RSI slow 40 (blue), VWMA fast 10 (white).
2022 YTD
MTB +6.17%
WFC +1.62%
SCHW -2.77%
USB -6.96%
BANC -7.25%
STT -9.4%
ALLY -10.05%
BAC -10.78%
MS -14.15%
C -15.53%
JPM -15.63%
GS -15.74%
BK -16.70%
BLK -19.67%
SYF -21.13%
FRC - 23.55%
4/13
JPM 7:05am
BLK 6:30am
FRC 7am
4/14
GS 7:30am
WFC 7am
C 8am
MS 7:30am
ALLY 7:25am
USB 6:45am
STT 7:30am
4/18
BAC 6:45am
SCHW 8:45am
BK 6:30am
SYF 6am
4/20
MTB 6:35am
4/21
BANC 6am
Do your own due diligence, your risk is 100% your responsibility. This is for educational and entertainment purposes only. You win some or you learn some. Consider being charitable with some of your profit to help humankind. Good luck and happy trading friends...
*3x lucky 7s of trading*
7pt Trading compass:
Price action, entry/exit
Volume average/direction
Trend, patterns, momentum
Newsworthy current events
Revenue
Earnings
Balance sheet
7 Common mistakes:
+5% portfolio trades, capital risk management
Beware of analyst's motives
Emotions & Opinions
FOMO : bad timing, the market is ruthless, be shrewd
Lack of planning & discipline
Forgetting restraint
Obdurate repetitive errors, no adaptation
7 Important tools:
Trading View app!, Brokerage UI
Accurate indicators & settings
Wide screen monitor/s
Trading log (pencil & graph paper)
Big, organized desk
Reading books, playing chess
Sorted watch-list
Checkout my indicators:
Fibonacci VIP - volume
Fibonacci MA7 - price
pi RSI - trend momentum
TTC - trend channel
AlertiT - notification
tickerTracker - MFI Oscillator
www.tradingview.com

JPMEarning came, not that bad.
price is in support area
also in a downtrend channel
long doji candle stick with hight volume at the downtrend means bullish to me.
but if it broke down side there is no major support to hold it


JPM profit falls in Q1 JPMorgan Q1 net income $8.3 billion, or $2.63 per share, -42% from Q1 of 2021 when JPM posted a profit of $14.3 billion, or $4.50 per share.
I expect a retracement to the $119 support on this news, if not even lower.

JPM-22 ANALYSIS i am waiting the price to touch the channel trend line then i we can jump with the beautiful long position

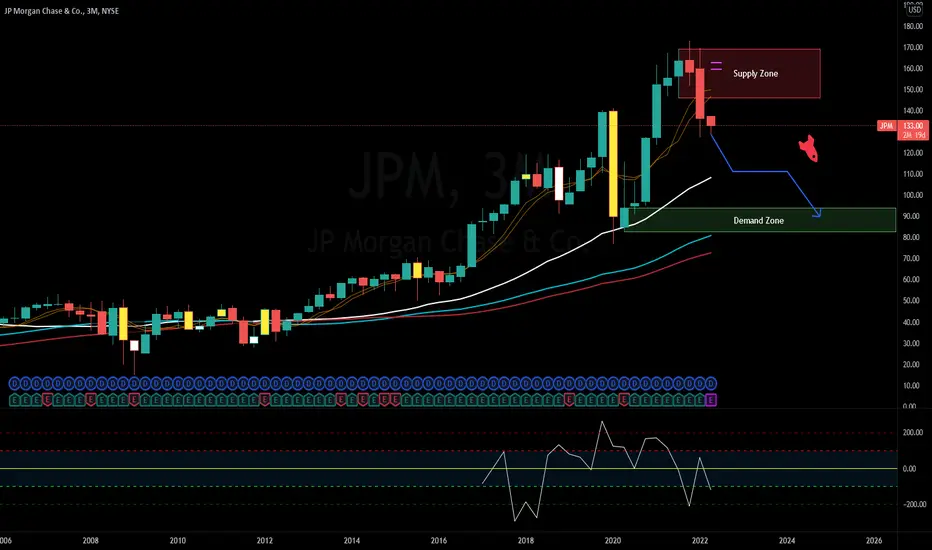
$JPM Quaterly Chart ShortJPM is currently trading down from a quarterly Supply Zone . Short to Demand around 96$

JP MORGAN CHASE & COThe downward trend is expected to continue.
Target 1 - $116.70
DISCLAIMER: This is an idea only and we are not responsible for any profits or losses arising from trading.

Trading Idea - #JPMorganMy trading idea for JP Morgan - SHORT / SELL
Entry: 133.20 USD
Target: 108.00 USD (+18% profit)
Stop: 146.10 USD
JPMorgan Chase & Co . is a global financial services company. The company operates in four segments: consumer & community banking ( CCB ), corporate & investment bank ( CIB ), commercial banking ( CB ) and asset & wealth management ( AWM ).
U.S. banks face huge earnings losses. First-quarter profit expectations for major banks have been cut considering the Russia sanctions and a severe slowdown in business activity.
JPMorgan (NYSE:JPM) is the 17th most popular stock among hedge funds, according to a study by ClearBridge Investments. JPMorgan was in 107 hedge fund portfolios in the fourth quarter of 2021, compared with 101 in the previous quarter. Even with the increasing interest from institutional investors, the stock has lost about -20% in the last 3 months!
Insiders believe "JPMorgan Chase is too big to fail". JPMorgan is indeed an influencing giant of the financial world, but a share price recovery also depends on the global economy and its recovery.
In terms of the chart, we have been in a strong downtrend since November 2021. Again and again, there have been strong moves to counteract it. This has led to high volatility in the share. The SHORT momentum remains and solid ground by a support level is not really in sight.

$JPM Key Levels, Analysis, & Targets$JPM Key Levels, Analysis, & Targets
As long as MacD is under the centerline these are my targets.
I’m not sure how I’m going to play this yet, though…. I’ll wait until after earnings, and honestly I might wait on JPM for some of the lower targets… I've got my alerts set...
------
I am not your financial advisor. Watch my setups first before you jump in… My trade set ups work very well and they are for my personal reference and if you decide to trade them you do so at your own risk. I will gladly answer questions to the best of my knowledge but ultimately the risk is on you. I will update targets as needed.
GL and happy trading.
IF you need anything analyzed Technically just comment with the Ticker and I’ll do it as soon as possible…

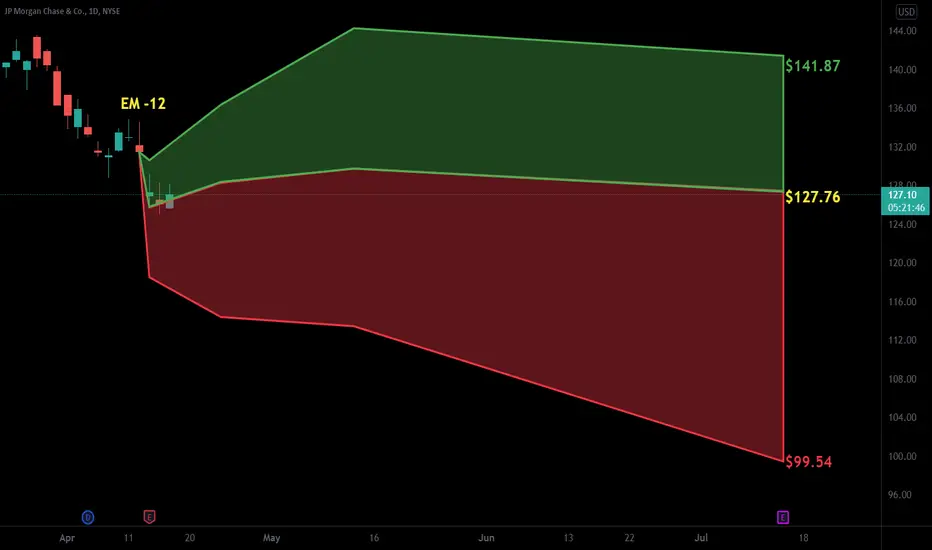
JPM - Too Soon for BuyNYSE:JPM is modelling the big orange arrow, mentioned on the chart, on its correction movement. For doing so, it has a PRZ of $112.4 zone (somewhen between May and July, 2022). If the price breakdown $127.8 low, both the PRZ and TRZ mentioned on the chart are valid for NYSE:JPM . For the next move, we can expect a buy position using trigger on the bottom of the channel (which is also our PRZ). However, it is too soon for thinking about buying this stock.

JP Morgan Continuing the declineUnfortunately for JP Morgan the trend is not good and I am yet to see anything to change my mind. I currently am shorting this stock with 12% of my portfolio.
The below are the losses across the period.
Last periods:
- 6 months down 18.95%
- 1 month down 2.85%
- 5 days down 2.85%
- 1 day down 0.78%

Patience is the KeyIf we hit the previous lows (or slightly cut under that - that's even better), we could get text-book reset on daily.
It fits the overall market direction - retest lows and move up for few months.
My ideas are mostly based on technical analysis and few fundamentals, but I don't follow specific indicator.
I have some know-how by looking across several indicators. Of course, I might be wrong as well.
Forecasting bottoms and tops, not target levels or price path.
Don't forget to enjoy your day:)
Disclaimer:
This is my personal journal, not investment advice for anyone.

J-P MORGAN, On The VERGE To A PRECARIOUS BREAKDOWN!Hello,
Welcome to this analysis about JP Morgan And Chase on the monthly timeframe perspectives. The stock market is battered because of the ongoing war-dynamics and history has repeatedly shown that during such times the market is either going sideways or has a bearish edge, these indications should not be underestimated when assessing the stock market and stocks within the stock market and therefore there is a higher tendency for the market to show up with further bearish volatilities in the next times. When looking at my chart with JP Morgan And Chase now we can watch there that the stock is building a precarious massive formation which is actually an ascending-wedge-formation with a wave-count within the formation, such a formation normally signals a devastating reversal to emerge. Besides that JP Morgan and Chase has a decreasing-volatility-circle which means the bullish strength is decreasing more and more inclined with the actual wedge-formation forming here. Together with these crucial indications JP Morgan And Chase also forms this main RSI-Bearish-Divergence as a additional indication for this whole formation to be completed. Therefore when looking at these whole dynamics the bearish upcoming perspectives should in any case not be put from the desk here and once the target zone has been reached there is still the possibility that the stock continues further, it will be a critical development ahead.
In this manner, thank you for watching the analysis, all the best!
"The high destiny of the market is to explicate, rather than to speculate."
Information provided is only educational and should not be used to take action in the markets.

JPMorgan investmentsThe US banking sector was more resistant to a bear trend than a number of other top companies in the country, which are included in the main indices. Now the indicators of American companies and indices begin to show growth trend! But still have a good price purchase price. This is a major investor. American billionaires, as well as finnish agencies. Such as Bank JPMorgan! The leading banks of the United States keep about 30-40 percent of their capital in the top companies in the country. And this year can become very favorable for investment in such assets. The situation in the stock market of America can repeat the situation of 2020. When the market showed a strong collapse at the beginning of the pandemic, and then showed high growth volatility and brought the market to new historical maxima. In this case, the purchase of US securities banks at the beginning of a bullish trend will provide an opportunity to get high profits! And accordingly, make high indicators of the price of their securities !!!

JPM LongGiven the recent market selloff, the reversal forming on the daily, and with interest rates on the rise, financial companies will begin to rally again. I'm looking to take a long-term position in JPM, given they are a leader in the market and pay a high dividend. Aiming to take next January's ATM (140) calls.

JPM price actionPrice action on JPM doesn't look too much optimistic even that we are going into higher interest rate environment.
