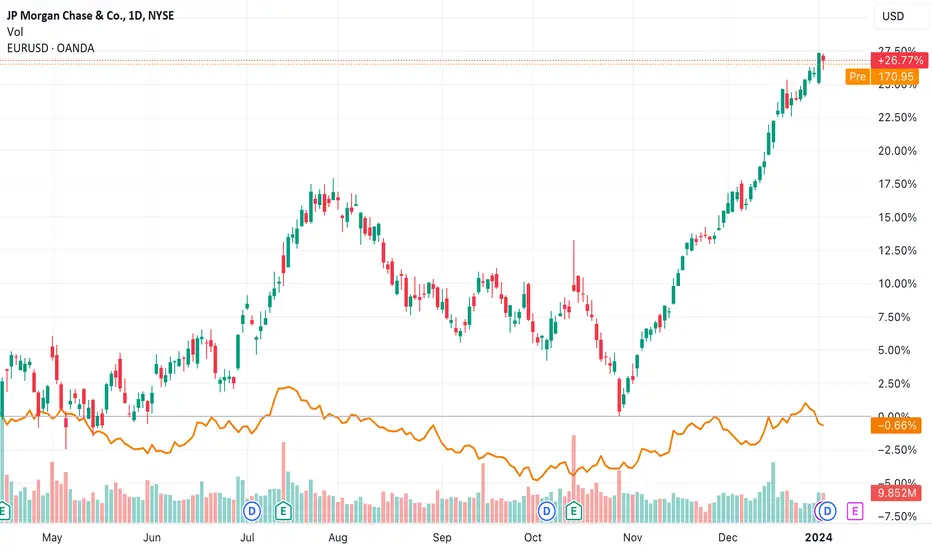
JPM @ $175.10If you look at this chart you will notice that the resistance is above the 50 EMA.
To Be honest NYSE:JPM is oversold.
Do you see that the chart has been up-trending?
Learn the rocket booster strategy check out the references below.
Also notice that this uptrend is very much near the resistance.
With the Rocket Booster Strategy you will understand the direction of the price.
Remember the price is near resistance.Also do not use margin.
Disclaimer:This is not financial advice do your own research before you buy or sell anything and do not buy or sell anything i recommend to you.Take this as a warning you will lose money in trading, so learn risk management strategies as well.
JPM trade ideas

JPM support and resistance 4hr chartIf it can just get up and past 176 it could then head for 178 supply. If if can't break through them maybe back down to 172 demand.

Short at all time highAs many financial equities have had a hard time during these economically challenged hardships are for the average consumer, without realizing this as a Major bank and would most likely be provided help from the government if any issues were to arise to its value. From a technical perspective, price is currently sitting at an all time high banks or the financial sector in general have fared poorly amongst these high interest rate environment. It may be time to short or take profits near its all time high even breaking above its most recent highs, although the uptrend has stayed strong the sentiment around the market hasn't changed. as many finance stocks have suffered although value has held, from a technical trader its about time to exit and take profit. 2024 leading into 2025 with no answer to when interest rate cuts will happen or not happen anytime soon is on all investors minds, ones investment should be moved elsewhere very soon as high interest rates for longer.

JPM SHORT FORECAST Q1 24 : RECESSION SEASON ???My analysis was based on the AMEX:IYF then down to the AMEX:IAT
so i have nothing to say about this "company"
quote on company but to my spec life ninjas (speculator life)
who look at stocks
price has hit the strongest zone on a multi timeframe perspective
and im expecting it to drive lower considering the 2 major wicks
its giving bull trend exhaustion fasho and i dont expect a petty pull back
this is the WEEKLY TIMEFRAME
and very little resistance formed during the bull run
Fundamentals (the real reason why im shorting): rates too high for too long blah blah if cut too soon inflation blah blah lets short (or not its up to you)
marked my reversal price levels and will update where to if this post is followed enough (just like to indicate that you down fo mo updates)
im picking JPM and some other stocks that will yield more in the industry maybe more will
bankrupt this year
pro tip from a big steppa: monitor your sector etfs weekly

JPM - shortMagic combo: bad earnings + weak market, particularly financials (FAS) look bearish. Big sell volume. MA 100 just crossed above MA50 on the hourly timeframe.
Head and shoulders at the hourly timeframe.
Can find support at SMA 200, about 147


JP Morgan Short off All Time HighWith the stock market making new All Time Highs fresh new opportunities for contrarian trades are going to be somewhat scarce. Thanks to a viewer on my Livestream (every Friday on Tradingview: 4pm EST UTC-5) I was made aware of a short setup I like on NYSE:JPM
Context
This price action is happening at a test of the past ATH set in November 2021. Last week the Earnings announcement pushed price intraday above the high only to close well below the key Resistance level of the former ATH. This is a false breakout signal or as I like to identify them as: Spikes.
The Spike
The Spike occurred on Earnings. I have found that false breakouts on earnings have a very high probability of signaling a reversal. The significance value (135% ATR) is within my rules. It took until the following week for price to actually pull back to the proper entry point of the Spike bar's Tenkan Sen value at 172.48. What these factors mean I go over during my Livestream.
The Trade
How I am expressing this trade is in a combination of short shares and Puts.
In choosing my Put strike I look for where I see price going as a target via technical analysis. In this case it would be the 50% Retracement of the bullish trend around 155.
For expiration I consider the prior bullish trend that got price up to the high I am reading as a false breakout to enter. I project the time that trend took, add an additional month as a time buffer, and then typically take that expiration. Unfortunately, an option expiring in March as this technique would suggest puts the expiration too close and just before earnings.
A note about options and earnings: In the 4 weeks prior to earnings very typically a stock's options will experience a rise in IV (implied volatility). This rise in IV and the Greek Vega can increase the prices of all options often offsetting the value lost to theta time decay. This is a very advantageous condition if a trader is long single options. Therefor, I chose the April expirations to give myself the potential for the IV push. I will likely close the options the day before earnings regardless of where price may be. Options are a coin flip.

What Too Big to FAIL Look Like? JPMThis chart was originally looking at GANN angles for JPM. Keep in mind this is not scaled- primarily to show the graphics better, but also suggests the volatility is native to the price action when it is scaled. JPM is the largest bank in the US. As far as I can see the top was reached 2 yrs ago during CV19 height. The new paradigm is a down wave. There is already a hint of an additional bearish pattern forming. This harmonic is a shark pattern, but they have a tendency after the C wave to turn down and sometimes very harshly (just the nature of the harmonic). They can be bearish or bullish, but only after the entire bearish embedded harmonic sentiment has ran their course. Note this same type of pattern in Bitcoin (slightly different but the same). How far down?? Leave your comment below.
The FED is printing money at an unstoppable rate and has been doing so. Inflation is rising not just nationally but Globally. Sure we do get the hints of better days, but they are short lived. I think this is primarily because there wasn't as harsh of an economic impact during COVID. Now that the pandemic is subsiding some (still not gone), the money printer is being over worked to a point where it may not be able to do much at all. Large companies are laying off (reminiscent of pre COVID days). There are other indicators as well in the DOW and NYSE to further support something BIG is bound to happen THIS YEAR and within the next 30-90 days which could further last well into the next few years. How bad will it get??? I am only providing the acronyms as they relate to the different levels. Keep in mind we are still in an overall bearish cycle and these small pumps we get are the hints of the money injections attempting to revive things. Banks are teetering and a few have failed. NOTE: There are banks out there in worst condition than the ones that were bailed out. What happens to them? It has already been noted that there is not enough FDIC insurance to cover everyone so when PANIC sets in it just doesn't look good. I hope this is all wrong, because if it is not May God have Mercy on the souls of the many across this Nation and the Globe. I am also looking at crypto markets taking a dive as well, but maybe not as bad as the traditional markets which more people are exposed to. Once the PANIC level is reached I think its going to get ugly very quickly. It may happen sooner than later. Stay vigilant!
I warrant that the information created and published, doesn't constitute investment advice, and isn't created solely for qualified investors.

jpm $168 to make $82 selling put verticals above 172.5$168 to make $82 selling put verticals above 172.5

$JPM Bear Flag at All Time HighNYSE:JPM Bear Flag at All Time High. A bear flag is a technical analysis pattern that typically occurs after a significant downward price movement. It is identified by a rectangular-shaped consolidation, resembling a flag, that slopes against the prevailing trend. The flagpole represents the initial sharp decline, followed by a period of consolidation forming the flag. Traders often interpret the bear flag as a potential continuation pattern, suggesting that the previous downtrend may resume after the consolidation period, leading to further price declines.

JP Morgan .. Diamonds aren’t Forever JPM, and for that mater virtually all bank shares have had an incredible run since late October.
The acid test will be the JPM earnings release this Friday… will loan provisions, a more accurate mark to market accounting and delayed tax selling finally catch up ?? … Stay tuned.
Harmonically we are in an interesting crossroads with a 5-0 harmonic pattern in evidence. Also at the $180+ plus area a harmonic crab pattern takes shape.
Additionally we appear overbought with bearish divergence and wait for a momentum reversal.
A break of the $169 area should get this going.
Watch the broad market and a loss of momentum for clues.
Worth watching IMHO with a mid $150 target area.
Not investment advice do your own due diligence and watch the broad markets.
Good Luck
S.

JPMorgan's 4Q 2023: Navigating Challenges Amidst Resilience
In the intricate dance of finance, JPMorgan's fourth-quarter 2023 results unveil a narrative of resilience, strategic prowess, and a cautious gaze toward potential headwinds. As the behemoth financial institution reported adjusted earnings of $3.97 per share, surpassing expectations, CEO Jamie Dimon's reflections on the U.S. economy's resilience and his cautionary notes create a backdrop for a compelling analysis.
The Triumphs:
JPMorgan's stellar performance was propelled by a trio of factors – higher interest rates, the transformative First Republic Bank deal, and a moderate improvement in the Investment Banking (IB) segment. The adjusted earnings of $3.97 per share handily outpaced the Zacks Consensus Estimate, revealing a financial powerhouse that knows how to navigate challenges.
Strategic Moves:
The strategic landscape unfolded with notable achievements. The First Republic Bank deal and higher interest rates were pivotal in supporting Net Interest Income (NII), projected to hit $90 billion in the coming year. Commercial Banking witnessed a surge in average loan balances, while the IB business exhibited a commendable 13% increase in total fees. JPMorgan's calculated market moves showcased its ability to harness opportunities even in a dynamic environment.
Economic Caution and Global Uncertainties:
However, amidst the triumphs, Jamie Dimon's cautionary remarks echo the realities of the broader economic landscape. Stickier inflation and the geopolitical tensions in Ukraine and the Middle East pose potential threats, emphasizing the need for a vigilant approach. JPMorgan's acknowledgement of these challenges underscores the delicate balance the institution maintains in navigating global uncertainties.
Challenges and Concerns:
The financial tale is not devoid of challenges. Operating expenses witnessed an uptick, with adjusted non-interest expenses expected to hover around $90 billion. Net income, though robust in most segments, declined by 15%, raising eyebrows amid projections of a potential economic slowdown and reduced loan demand.
Financial Metrics Unveiled:
The financial metrics paint a comprehensive picture. Net revenues surged by 12% to $38.57 billion, yet fell short of the Zacks Consensus Estimate. NII witnessed a commendable 19% YoY increase to $24.05 billion, fueled by higher rates and revolving balances in Card Services. Non-interest income grew by a modest 1%, but non-interest expenses surged by 29%, partly due to the FDIC special assessment charge and rising compensation expenses.

$JPM JP Morgan about to drop below 2000 & 2008 crisisLower prices means a big movement in the market, i believe will happen soon in this Q1 2024. An initial volatile push to the lows and eventually at the end of the recession 2024-2025 below $20. Caution with your money.
Induction already endend, no more room to the upside.

Sell or Short $JPM JP Morgan It is probably wise to sell NYSE:JPM JP Morgan shares after a strong rally.
We could be seeing a double top, and is due for a correction or hard sell-off.
I think most of the banking sector is in trouble, and that will be coming to light in the next few weeks.
Sell JPM and the US Banking sector in General as it looks like the Long Financial Trend could reverse soon.
You may want to go long on AMEX:FAZ , a 3x leveraged Financials Bear ETF as a hedge if the Financial Sector starts selling off.

JPM Stock Hits All-time HighThis week the reporting season begins — company results for the 4th quarter will certainly become one of the most important drivers of stock index prices, along with the publication of news about inflation, the labor market, and statements from the Federal Reserve.
Large banks will traditionally be among the first to report: JP Morgan, Bank of America, Wells Fargo, Citi. The banking sector looks frankly strong at the beginning of 2024. While the S&P-500 is down 1% in the first week, the XLF financial sector fund is holding near the year's opening price.
According to MarketWatch, bank stocks are becoming increasingly popular amid expectations of a positive yield curve in the second half of 2024, and analysts have set “buy” ratings on shares of Goldman Sachs, Morgan Stanley and Wells Fargo (WFC).
It should be noted that shares of JP Morgan bank set a historical record. The previous high set on October 25, 2021 was USD 172.75 per share. At its peak last Friday, the price reached USD 173.19 per share.
The growth of JPM shares is facilitated by the dividend policy:
→ January 2024: USD 1.05 per share;
→ January 2023: USD 1.00 per share;
→ January 2022: USD 1.00 per share;
→ January 2021: USD 0.90 per share;
→ January 2020: USD 0.90 per share.
JPM data will be published on Friday. Will the price be able to maintain its highs?
There are some concerns.
From a fundamental point of view, in the current economic environment, with inflation remaining above target and interest rates at high levels, the results for the 4th quarter may disappoint.
From a technical standpoint, the JPM price chart shows signs of a bearish reversal:
→ divergence on the RSI indicator;
→ potential intersection of MACD curves;
→ long upper shadows on the last candles show signs of selling pressure.
Thus, the market can form a false bullish breakout of the previous high. It is possible that the price of JPM shares, against the backdrop of news about the bank’s activities, may fall closer to the former resistance around USD 159.
This article represents the opinion of the Companies operating under the FXOpen brand only. It is not to be construed as an offer, solicitation, or recommendation with respect to products and services provided by the Companies operating under the FXOpen brand, nor is it to be considered financial advice.


Over-speculated Patterns Heading Into Earnings SeasonNYSE:JPM is the last Bank that has been able to hold onto its Dow 30 component status. It is running up on a combination of buybacks and ETF development for Dow 30 index components.
The stock is over-speculated heading into the earnings season. Volume Oscillators show the extreme pattern clearly. So even minimal weakness in the earnings report could cause an HFT trigger. It might surprise either way.
Some of its growth in 2023 was due to the regional bank debacle when JPM chose certain small banks to target for a silent hostile takeover.

Bank of America, Daily
Bank of America Corporation (symbol ‘BAC’) share price rose by around 22% in the last quarter of the year and managed to cover the losses incurred in the previous quarter. The company is expected to report its earnings for the fiscal quarter ending December 2023 on Friday 12th of January before market open. The consensus EPS for the quarter is $0.68 compared to the result for the same quarter last year of $0.85.
‘ Bank of America had steady increasing net income throughout the whole of 2023 while its debt makes up only 10% of its total liabilities. Even though these might show a sound positive balance sheet , the current ratio says otherwise. The company has a current ratio of just 83% which means that it does not have the ability to repay its short term liabilities with the current assets at hand. This might be a dealbreaker for some investors to divert their capital into the company as an investment.’ said Antreas Themistokleous, an analyst at Exness.
From the technical analysis perspective the price had a rather steady bullish trend in the last couple of months and is currently testing the support level of the 61.8% of the weekly Fibonacci retracement level. The Stochastic has been recording extreme overbought levels for about 2 months while at the same time the bullish momentum is shown to be slowing down. Both of these indicate that it is possible to see a correction to the downside in the near short term. If this is the case then the first area of possible support might be found around the $ 32 price area which is made up of the 50% of the weekly Fibonacci retracement level as well as the inside support area of price reaction in early August. A second area of possible support could be the $30 price level which consists of the touch of the lower band of the Bollinger bands and the 50 day moving average, the 38.2% of the weekly Fibonacci retracement level and also the psychological support of the round number.
JP Morgan Chase & Co, Daily
Shares in JP Morgan Chase and Co (symbol ‘JPM’) had a rather aggressive bullish rally beginning in late October and managed to gain around 20% in just 2 months. JPM is expected to release its earnings report for the quarter ending December 2023 on Friday 12 January, before market open. The consensus estimate for earnings per share is $3.64 compared to the result for the same quarter last year of $3.57.
‘ As of 30/09/2023 the net income of the bank has increased by 37% year over year while at the same time the current ratio is at 90% indicating that any short term turmoil could potentially have a significant impact on the operations of the company. From a dividend perspective the yield is currently at 2.34% which is rather positive from the shareholders viewpoint making the share of the company somewhat more attractive.’ said Antreas Themistokleous, an analyst at Exness.
On the technical side the price has been trading in a steady bullish momentum for the last 2 months and is on track to break it's all time high level of $171.78 which was set on 22 October 2021. The Stochastic oscillator is in the extreme overbought level for a prolonged amount of time while the price is trading above all technical indicators potentially indicating a correction in the following sessions leading up to the earnings release. On the other hand the 50 day moving average is trading above the slower 100 day moving average validating the overall bullish trend in the market.

JP MORGAN Approaching the ideal sell level.JP Morgan Chase (JPM) has been trading within a Channel Up pattern since the October 12 2022 market bottom. Currently it is on a relentless rally since the October 27 2023 Higher Low, which is technically the Bullish Leg towards the Channel's top and new Higher High.
The peak points of the previous two main Bullish Legs of the Channel Up, took place when the 1D RSI formed Lower Highs against the price's Higher Highs, which is a technical Bearish Divergence. Since the price is currently so close to the top of the Channel Up, we will wait for the RSI to form that Lower High sequence and enter a confirmed sell. Our target will be 163.00, which is a projected contact with the 1D MA50 (blue trend-line) and the 0.382 Fibonacci Channel level, which has always been reached during Bearish Legs.
-------------------------------------------------------------------------------
** Please LIKE 👍, FOLLOW ✅, SHARE 🙌 and COMMENT ✍ if you enjoy this idea! Also share your ideas and charts in the comments section below! This is best way to keep it relevant, support us, keep the content here free and allow the idea to reach as many people as possible. **
-------------------------------------------------------------------------------
💸💸💸💸💸💸
👇 👇 👇 👇 👇 👇

JP MORGAN: Can extend this rise to the top of the Channel UpJPM may be overbought on the 1D technical outlook (RSI = 82.199, MACD = 3.72, ADX = 70.645) but is extending the bullish leg of the 14 month Channel Up. It sits comfortably over its middle and calls for an extension. We will enter on the closing of the first red 1D candle and target the 1.618 Fibonacci extension (TP = 174.00), which was the December 1st 2022 HH.
See how our prior idea has worked:
## If you like our free content follow our profile to get more daily ideas. ##
## Comments and likes are greatly appreciated. ##

JP Morgan Priced in GoldStill no breakdown for JP Morgan priced in gold.
Still at same level it was over 20 years ago.
#Gold #JPMorgan

JPM time to run awayJPM was in a huge symmetrical triangle, and a few days ago, it broke out of it. However, while breaking out of it, JPM was already overbought, and there is a small chance it can continue with this pump further without cooling down.
Yesterday it made a huge bearish reversal engulfing candle, which is showing the turnaround is here. MACD is trying to turn down, while RSI, from overbought territory, is trending down.
For bulls, the only chance is for JPM to stall here, stop its dropping above the trend line on small volume for several days, and then break strong up.
For bears, well, if JPM returns to the symmetrical triangle, it would represent an extremely powerful bearish pattern called a fake breakout or better call it a bearish dead hook and would indicate a strong drop is ahead of us. The drop would be almost certain towards the 200-day MA and upsloping trendline around $144.
