$LABU Breaking Out Off Weekly Chart$LABU set to test higher prices as it breaks out of its bullish descending wedge pattern.
Daily positive divergence on MACD.
First target $86 with stop at recent lows.
LABU trade ideas


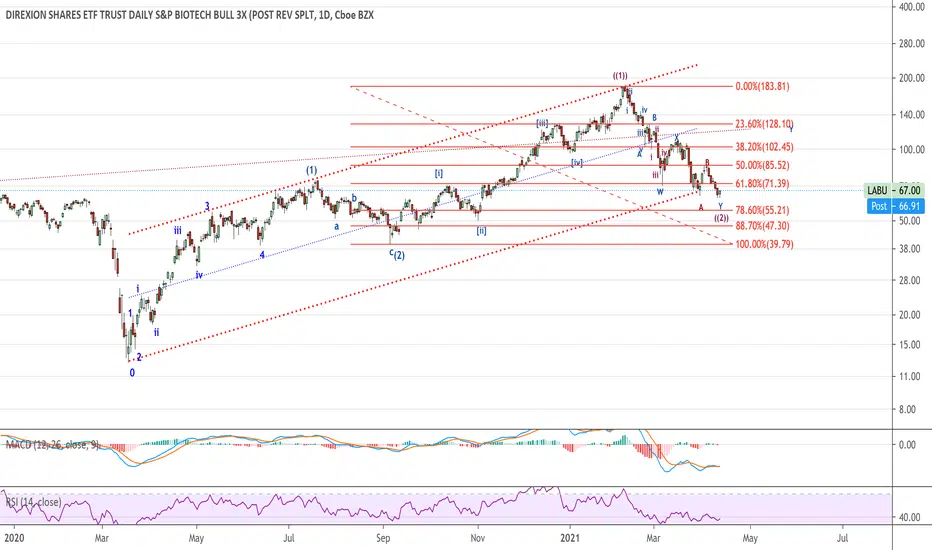
LABU: One of the most hated Tech Sectors.Still falling even as NDX bottomed in March. Now it appears that it is printing an ending diagonal too.


Bullish Divergence Watchlist. LABU. Is there any particular setup people would like to see me posting consistently? I don't want to leave people behind when I start doing something different. And you would be helping me too because it's always beneficial to make sure the fundamentals are solid.
If you have a concept you'd like me to work through please leave a message below. No one is asking me to do anything at this point in time so you would be first in line. I get tired of bossing myself around sometimes. Sometimes though, ok, please let's keep it civil if at all possible.


LABU: This is tricky. While the NDX bottomed on March 4, Biotechdid not. It printed a WXY three weeks later. Today is likely the bottom of Y.


LABU: Bottom Channel and Long term trend line provides supportFib 38.2 reached.Target is major fib extension of A=C


Looking readyLooking for a nice long to the PT. I will wait for open and see where we go. This should be a nice play next week if not we will wait for a bigger pullback to the red.
stonks


LABU Long (Monthly)LABU Long analysis on the monthly. Looks like a lot of accumulation looking to breakout biggins.

LABU - daily chart SELL around 66.20
T1 56.55
T2 50.15
SL closing up 70.55
70.55 This is the highest of the candlestick pattern called bearish engulfing

Buying opportunity here below 55. Looking for reversal.Long here 54.4. Looking for a reversal today and a continued breakout of this channel.

Biotech Bounce and Breakout?LABU is showing really good support. It's currently in a decline but should hold at $48.95 ish with a bounce and possible triangular breakout.


LABU (XBI) LONG - Price Target: $70. Moving average convergence/divergence crossover on multiple timeframes, RSI rising quickly out of overbought area, price bounced off of a long term price support/resistance line.
Target $70 : Tight stop loss

In here 51.69 on a triple bottom. Target 55+Looking for a quick trade back to the 55/57 range early this week.


Biotech's Lookin' Good (for a bit at least)Bull flag that looked for a short while like it was pulling a head-fake and retreating but in the last hour of trading (as always) my instincts are rewarded and it continues to climb up. I've put in a prospective overhead resistance but remember to trail your stops because anything can happen! Other ETF's are looking bullish too like DRN, SOXL and TECL.
