MRK Long w/ Earnings expectationsMRK was down 3.81% today just like precedent times before earnings.
Here's my analysis, the stock is going up this next days to join the channel support and with the earnings will go up again for a long swing.
***
This is MY analysis, it is not a recommendation.
***
MRK trade ideas


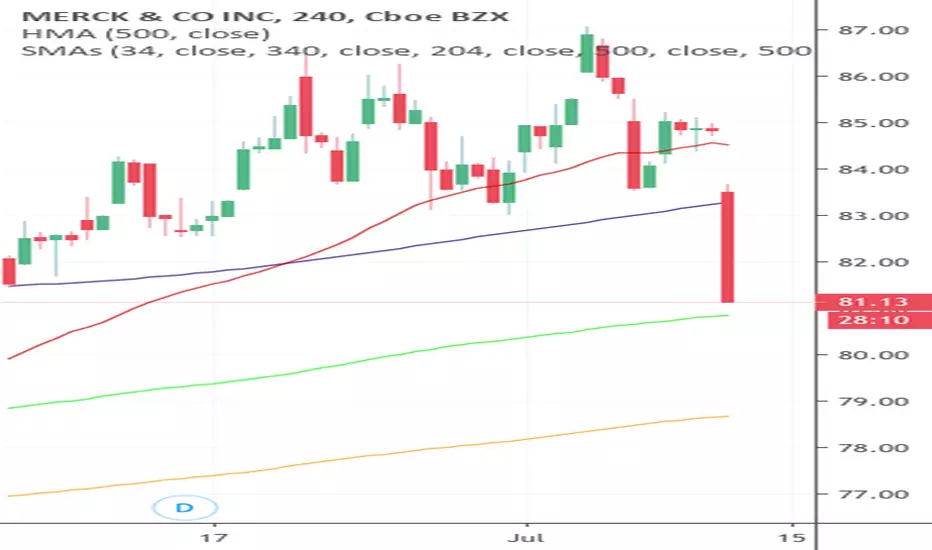
MRKMRK looks good here up to 88. Safest entry is waiting on a retest of the channel around 80. Looks even better if you believe the market is going to sell-off after the fed cuts rates. Everything sells off in bear markets, but healthcare is a "safety" investment that typically a lot of people will put money into when the market starts to sell-off the first time off of ATH's. (2018 October and May 2019 for example)
Earnings are coming up though. Which means a high volume day either up or down. Being that we are sitting on the bottom side of this channel, be very careful not to get caught on an impulsive sell-off if that breaks. Being that all news is good news this earning season, this seems unlikely, but still possible.
*NOT Trade recommendations, Always do your own analysis!**

Look for Merck to respect trend line before enteringMerck ended the day near the bottom of its parallel channel, right above a high-volume support node at 8.19 and a trend line that's parallel with channel bottom. After hours, the price has moved below both the support and the trend line, but in my experience, after hours moves don't necessarily mean much. The real test will be tomorrow after market open. If the trend line breaks, then the price will test the bottom of the channel. That will be an opportunity for an entry with a tight stop loss.
Merck had a product launch after hours today (a smart pet feeder) that could help move the price upward, but honestly this stock has so many catalysts that I'm not sure investors pay much attention to them anymore. This one is pretty minor in the scheme of things. More important factors are Merck's strong analyst ratings and long history of earnings beats. One possible downside catalyst is Merck's slightly negative Earnings Surprise Prediction from Zacks.


$MRK Merck & CO Inc. still in 19 year recovery cycleOn the daily chart of NYSE:MRK it seems that a nice breakout rally is setting up, with $84 as a good point to evaluate your position. The chart accompanying this post is merely a look at the nature of declines that a stock can suffer, to get back to the 2000 price level may take a possible 21 years, that is a long to hold and pray. It teaches us the lesson that stocks can keep going down, so accept you lose quickly and don't wait 20 years for it to claw its way back. Every company that we invest in is just one mistake or headline away from the fate of falling like a stone and the only ones left holding on are those who just couldn't accept the loss in the hope it will be different next week.
"even the mighty can fall"
AVERAGE ANALYSTS PRICE TARGET $88
AVERAGE ANALYSTS RECOMMENDATION BUY
P/E RATIO 26
COMPANY PROFILE
Merck & Co., Inc. engages in the provision of health solutions through its prescription medicines, vaccines, biologic therapies, animal health, and consumer care products. It operates through the following segments: Pharmaceutical, Animal Health, Healthcare Services, and Alliances. The Pharmaceutical segment includes human health pharmaceutical and vaccine products. The Animal Health segment discovers, develops, manufactures, and markets animal health products, such as pharmaceutical and vaccine products, for the prevention, treatment and control of disease in livestock and companion animal species, which it sells to veterinarians, distributors, and animal producers. The Healthcare Services segment offers services and solutions that focus on engagement, health analytics, and clinical services to improve the value of care delivered to patients. The Alliances segment includes results from the Company's relationship with AstraZeneca LP related to sales of Nexium and Prilosec. The company was founded in 1891 and is headquartered in Kenilworth, NJ.


Ascending Broadening Wedge Sets Up Positive Risk: Reward Ratio With market internals showing signs of weakness and less and less mega pharma co.'s hitting new highs, FlashPoint Trading Academy has been on the hunt for a good shorting opportunity.
We've made plenty of money trading Merck to the long side and now its time to reverse our position. As you can see by the above chart pattern, MRK's price action has formed an Ascending Broadening Wedge Pattern. The April high should prove difficult to breach to the upside which is approximately 3 points away. On the other hand, a push below the rising blue trend line could send MRK spiraling back to support, $10 points away. 1:3 Risk to Reward.
Please click like and follow FlashPoint's other actionable trade ideas. Thank you!

MERK LONG UNTIL THE 200 DAILY SMA SUPPORT THE PRICESRSI in ipersell and prices stopped by 200 daily SMA. From this level is higly possible a reaction. Stop loss on the minimum of the last candle.

MRK needs to find support - what to look forHey everyone,
Moving away from the typical crypto posts today.
We are checking out MRK.
This stock has seen some hefty losses in the past few days, pushing the RSI into a oversold area
The increasing bear volume has not been supportive, and the price is breaking past the .382 fib level.
The stock is looking to find support, but the last few days have not shown any. Before entering into this long position, we need to see some consolidation on price and bullish movement.
Increasing bear volume after a week of losses is also not supportive of increasing price levels.
The RSI will need to cool off towards the 40-45 range before we can see some bullish movement.
After consolidation, wait for price to retreat to a newly made bullish fib level, signaling a new trend.
Once a new high is made, it opens the stock up to a head and shoulders pattern, pointing south again. We would need to see bullish divergence either from volume or from the RSI to bring price higher after this.
As is, we are in a bear movement that could pose a falling knife until proper support forms.
What do you think? Where could we support form?
-Block


Merck & Co # MRKthree months long bias.
expecting bigger retracement to the origin of the move.
waiting for new areas of demand on the weekly to be created or long at the fresh area of demand around 60 dollar a share


MRK- Donchian Channel Breakout- Buy signalEarnings winner on Keytruda sales. In @ $77.00. Tight stop - half the way down on today's candlestick ~ $76.49. (I am not about to lose money on this one-much). Has support at $76.50 ish. Nice long strong uptrend, hopefully the momentum will last. Will close after a 2-3 day swing. Will trail stop @ the 3 ema if it continues up - surfing the wave. Target could be $80, about a 3.5R trade.
Confirmation: RSI and stoichastics up - hopefully previous chop will resolve now that earnings is done.
