NEE watch $67.21-67.34: Key Resistance zone to Recovery WaveNEE struggling against a well proven resistance zone.
$67.21-67.34 is the immediate resistance of note.
$68.78-68.40 is next resistance and scalp target.
NEE trade ideas

Stock Of The Day / 05.22.25 / NEE05.22.2025 / NYSE:NEE
Fundamentals . Negative background due to the bill to cancel tax benefits for clean energy companies.
Technical analysis.
Daily chart: Downtrend.
Premarket: Gap Down on moderate volume.
Trading session: The primary impulse from the opening of the session was stopped at 66.50. Buyers' strength is insufficient and the price retests the 66.50 level, and the next pullback was significantly smaller than the previous one. We are considering a short trade to continue the downward movement.
Trading scenario: #breakout with retest of the 66.50 level
Entry: 66.36 after the breakdown and holding the price below the level.
Stop: 66.66 we hide it above the high of the last pullback.
Exit: Cover part of the position at 64.46 after a reaction to the round level of 64.00 and when the structure of the downtrend is broken, cover the remaining part of the position at 64.64 upon confirmation that downtrend is changed to uptrend.
Risk Rewards: 1/5
P.S. In order to understand the idea of the Stock Of The Day analysis, please read the following information .

Bullish on NEEI believe energy consumption is going to grow and has Y-o-Y increment in the energy sector.
NEE has increasing price and volume trend. Got both bullish signal supported by my strategy of price and volume.
Although last quarter report shows a bit down in the fundamental section. Well dividend yield is also good enough.
Another buy zone after the price breaks after 72 resistance and retraces at that level.

Next Era trade ideaA company dedicated to clean energy, focusing on solar and wind. With a large market cap and operating throughout Canada and the US, this company has proven itself being able to be profitable and grow. It looks like price has found support at the trend line and its possible we can get a second leg up.
Defensive Sector with Growth PotentialSupporting Arguments
Current Market Uncertainty Sustains Demand for the Defensive Sector. NEE represents the defensive utility sector. Given the current political and economic uncertainty in the market, there could be an additional catalyst for the company's stock price growth.
Demand for Green Energy from the IT Sector. More than 80% of the company's portfolio consists of renewable energy sources (RES). Demand from data centers in the IT sector may allow the company to outperform competitors.
Attractive Valuation Levels and Technical Outlook
Investment Thesis
NextEra Energy (NEE) has strong long-term growth prospects due to the increasing demand for RES and the electrification of various sectors. Their integrated business model, combining the regulated utility business FPL and the competitive renewable energy business NEER, ensures both stability and growth opportunities. NEE's leadership in RES production, along with investments in battery energy storage and gas infrastructure, allows the company to benefit from the growing demand for clean energy solutions.
Current Market Uncertainty Could Drive Stock Price Growth. Tariffs imposed by the administration on imports and their potential impact on the U.S. economy remain in investors' focus. The market has responded to high uncertainty with a significant correction in overheated sectors, and pressure may persist for some time. As a representative of the utility sector, NEE benefits from uncertainty and may continue its growth.
Demand for Green Energy from the IT Sector. The largest public companies continue to increase capital expenditures on AI infrastructure to stay competitive. A key component of such infrastructure is data centers, which consume large amounts of energy and contribute to increased environmental pollution. As a result, data center owners create strong demand for companies that provide access to RES. More than 80% of the company’s portfolio consists of renewable energy sources. Already, the company’s annual profit growth rate is twice as high as that of its competitors.
Attractive Valuation Levels and Technical Outlook. The company's stock is trading at the 200-day moving average and recently rebounded from the resistance line at the 50-day moving average, which could serve as a strong catalyst for movement toward the previous peak of $84.8. Based on the forward PEG ratio, the company is trading at about the same level as companies engaged in traditional energy sources for household supply, while maintaining profitability 5-15% higher than competitors. Based on the forward P/E ratio, the company appears cheaper than its closest direct competitors (18x vs. 20.5x).
Our target price is $82, with a "Buy" recommendation. We recommend setting a stop-loss at $64

Triangle Breakout for NextEra Energy. NEEPivots are always hard to pick. I can see at least two triangles here, which have both been broken out of. It may be an early impulse to a down going Elliott diagonal.
Volatility, momentum has been less and less bearish, while Bollinger Band derivative indicator is all over the place.
Yet, MIDAS is crossed and vWAP/US combo are aligned, below the candle and upgoing.

$NEE 75% PROFIT. *****DINOSOUR PATTERN***ESP and Book Value keep rising. Price keeps pushing up against the ceiling. The pressure is increasing and eventually the the ceiling will break.

The Quantum Capitalist $MU & $NEE Analysis 1/21/2025Simple strategy using top-down analysis to find entries, profit targets, and options contracts on Micron and Nextera Energy

To the TOPThe price is climbing back within the green channel.
In recent weeks, it reached the long-term support area of $65-66 (indicated in blue) and regained strength.
Now it is preparing to break the purple resistance in the coming week.
A close above will start the next bullish impulse towards the ATH indicated by the light blue resistance

LNG on NEE with proper STP LOSS placementThe Setup
The Long-term(M) chart is in an downtrend
The current-term(W) chart is in new formed uptrend
The small-term(D) chart used to ENTER and EXIT
The odd Enhancers
- the ENTER was in the DZ (demand zone) of the (W) chart Higher Low uptrend.
- tight STP loss
- if the DZ holds there is room for profit to run
The trade followed all the rules the ENTER and the EXIT or STP-Loss is calculated with a good Reward to Loss ratio.
The DZ did not hold on a bearish day and a close in the (D) day chart below the DZ, triggered my STP LOSS
I See the long-term(M) monthly chart is already in a technical downtrend. the Weekly Chart (W) did not break the (M) downtrend. By breaking the Demand zone, the Weekly chart is technically in a downtrend. Looking for opportunities to short

Nextera Energy(Extended Hours) | Chart & Forecast SummaryKey Indicators On Trade Set Up In General
1. Push Set Up
2. Range Set up
3. Break & Retest Set Up
Notes On Session
# Nextera Energy(Extended Hours)
- Double Formation
* ((Wedge Structure)) | Completed Survey
* 012345 | Wave Count | Entry Bias | Subdivision 1
- Triple Formation
* 88.50 USD | Area Of Value | Subdivision 2
* Numbered Retracement | Subdivision 3
* Daily Time Frame | Behavioural Settings Condition
Active Sessions On Relevant Range & Elemented Probabilities;
European Session(Upwards) - US-Session(Downwards) - Asian Session(Ranging)
Conclusion | Trade Plan Execution & Risk Management On Demand;
Overall Consensus | Sell

NEE Long OpportunityPrice has found support at the 200W EMA which coincides with a critical zone of support between $69 to $71. On the daily timeframe price looks to have formed a corrective move to the downside following 3 strong daily candles.
A long position can be entered here with a stop loss at $69.32 and price targets at $79, $86, $90

$NEE Drop - Base - DropThe Drop Base Drop pattern is a technical chart formation that suggests a possible continuation of an existing downtrend. This pattern typically begins with a significant price decline, which is then followed by a consolidation phase, characterized by sideways movement, referred to as the base. After this phase of consolidation, the downtrend is expected to resume, indicating that the bearish trend is likely to continue.

NYSE:NEE - ELLIOTT WAVE ANALYSIS: 22 NOV, 2024©Master of Elliott Wave: Hua (Shane) Cuong, CEWA-M.
Since the low at 47.15, I see a Five-waves push higher labeled 1-grey to 5-grey. Basically the 4-grey wave may have ended at 72.69 and the 5-grey wave is unfolding to push higher.
While price must remain above 72.69 to maintain this view.
Alternate Wave Count: Shows the 4-grey wave is longer than expected, but the low at 72.69 is still very important that price must remain above.

$NEE with a bullish outlook following its earnings #StocksThe PEAD projected a bullish outlook for NYSE:NEE after a positive over reaction following its earnings release placing the stock in drift B with an expected accuracy of 50%.

Florida HurricaneThe market gapped down and invalidated this option but the idea is still good and I've decided to publish it.

Watchlist: NEENEE came up on my stock scanner, so I'm adding it to my watchlist. I got a setup signal(1). Looking to enter long near the close of the day if the stock can manage to close above the last candle highs(2) with a stop-loss below (3) and a price target above(4). Also came from a recent very oversold zone (RSI-2) (5) which makes it extra juicy.
= = = =
"Success is just happiness. When you are happy, that is success."

NextEra Energy (NEE) – Ascending Channel Near Key ResistanceNextEra Energy - NYSE:NEE - is trading in a strong ascending channel with rising lows, converging toward a key resistance around $91.50 .
The stock is well above all moving averages, signaling bullish momentum. With an upcoming earnings report , NEE could break through to a new 2-year high, especially considering its potential benefit from the ongoing AI boom.
However, the RSI is running hot , so it’s crucial to keep an eye on the bottom channel support line for signs of weakness. A break below could signal a retracement, but for now, the setup looks strong for continued upside.
Do you think NEE can sustain this momentum, or is it at risk of overheating?


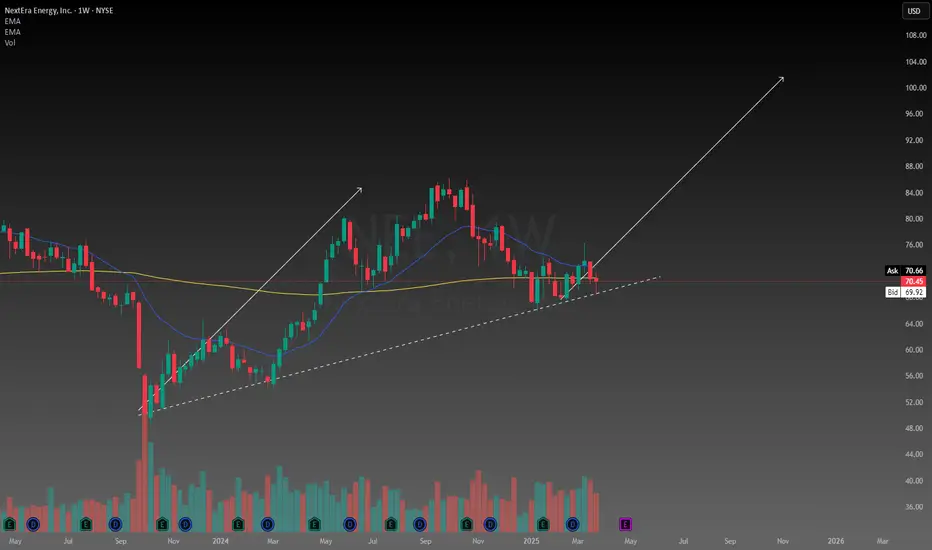
Energy is very long term bullishThis looks like it wants higher... very OG well positioned energy ticker.

All Eyez on $NEEI'm sure Tupac would appreciate that title shoutout!
But, on to NYSE:NEE , it is currently in my #BuyWholesaleSellRetail area, outperforming nicely right now. It was kind enough to give us a pullback. What are your thoughts?

See How This 3 Step Trading Strategy WorksThe rocket booster strategy is very simple and when you
watch this video you will see how to to use the the rocket booster strategy
watch the video below to learn more.
Disclaimer:Trading is risky you will lose money wether you like it or not please learn risk management and profit taking strategies to supplement this video lesson

Bonus Video: See How This 3 Step Trading Strategy WorksThe rocket booster strategy is very simple and when you
watch this video you will see how to to use the the rocket booster strategy
watch this video to learn more.
Disclaimer: Trading is risky you will lose money whether you like it or not please learn risk management and profit-taking strategies to supplement this video lesson
