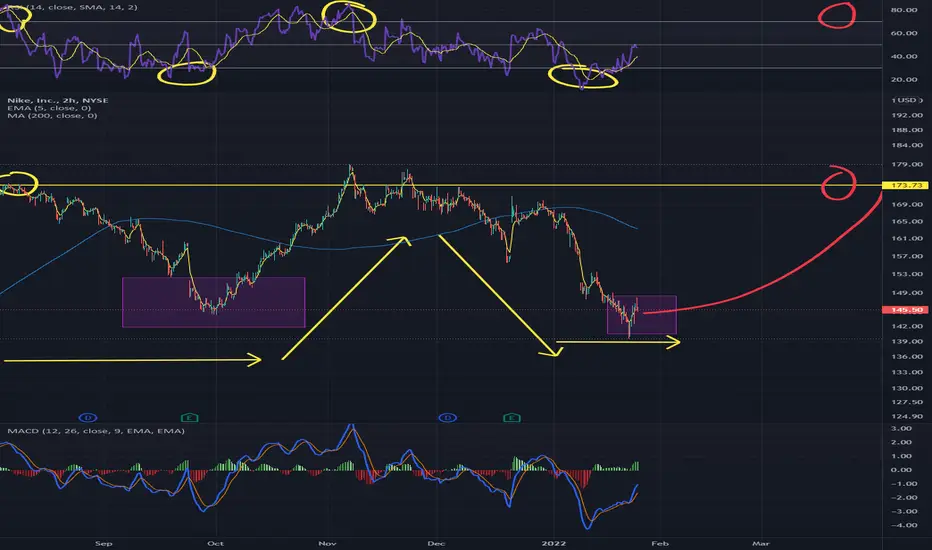
NKEOn the technical side, there are hopes for growth. These are divergences (although there is a hint of small hidden bears) and some sloping, conditional double bottom. If we fix above 148, then the growth will suggest further growth (as a confirmation).
However, globally xly and in general the index looks more down, it is more likely to go like a giant, along with the market.
So shorting is no. Waiting and thinking about buying with a range of 133-127 is interesting.
There is another remarkable thing, the report is coming soon and for several reports in a row it is clear that the stock is going down despite good reporting. This can be explained by the fact that the market wants to dump the overbought company, but the growth continues, probably due to the fact that the company's reports each time are better than expected. p/e=37, p/s=5 (the norm is about 3 for a company).
Summing up once again, it is not necessary to recklessly buy back in the indicated zone (with the exception of short-term speculative transactions), for medium-term speculation, it will be necessary to wait. A price of $100 is also likely.
(my vision. in general, I expect a decline in the market. the current growth of the last couple of days is nothing more than a rebound.)
NKE trade ideas

Elliott Wave View: Nike (NKE) At Potential Support AreaSince bottoming on March 18, 2020 low, Nike (NKE) rallied as a 5 waves into $179.10 which ended wave I on November 5, 2021 peak. Since then, the stock has corrected the cycle from March 2020 low within wave II. According to the 1 hour chart below, wave II pullback is complete at $137.41. The internal subdivision of wave II unfolded as a zigzag structure. Down from wave I, wave ((A)) ended at $155.47, rally in wave ((B)) ended at $171.19, and wave ((C)) ended at $137.41.
The stock has started to turn higher in wave III although it still needs to break above wave I at $179.10 to rule out a double correction. Up from wave II, wave 1 ended at $143.21 and pullback in wave 2 ended at $140.74. The stock resumes higher in wave 3 towards $146.32, pullback in wave 4 ended at $144.57. Expect the stock to rally 1 more leg higher to end wave 5 of (1). Afterwards, it should pullback in wave (2) to correct cycle from February 14 low before the rally resumes. Near term, as far as pivot at 137.41 low stays intact, expect pullback to find support in 3, 7, or 11 swing for further upside.


$NKE good Medium-Term entry (3/5)Conviction: 3/5
Hovering / bouncing off medium-term (2018) parallel channel support
Hovering / bouncing off short-term (2020) price level support
RSI-D looks like it is bouncing off from oversold levels
RSI-W approaching oversold levels
Risks
V expensive relative to own history, does not bode well for Long-term Returns
Expensive relative to market (e.g. S&P 500 P/S is 3ish)
Unimpressive growth
parallel channel support broken during 2020

Nike Double bottom w 618 pullback $NKE Wide stop but i like $NKE here, downtrend break w 618 pullback, after double bottom i highlighted. Noted measured move targets are listed w bills in order. Note abcd and 1.272 ext are very important to find measured moves and harmonic patterns. I will always watch futures and i only like this early, stop against low. I got alot questions regarding $PTON and $OIL set ups, I will be doign a video on exactly how i found both and caught pullbacks on both as well. (Plays in comment) Let me know if anyone wants clarification on how i find a certain set up
Targets
1.Top of first ab wave, take 1/2
2 .ABCD level (equal length drives, take 1/2 of balance
3. 1.272 extension (my favorite ext%) 1/2 of balance
4. 1.414 extension ''

Nike Playing the Short Game? Nike - Short Term - We look to Sell a break of 143.08 (stop at 148.92)
Posted a bearish Flag formation. A break of 143.00 is needed to confirm the outlook. Closed below the 20-day EMA. The bias is still for lower levels and we look for any gains to be limited. The primary trend remains bearish. Daily signals are bearish. The sequence for trading is lower lows and highs.
Our profit targets will be 126.53 and 119.05
Resistance: 150.00 / 155.00 / 160.00
Support: 140.00 / 130.00 / 120.00
Disclaimer – Saxo Bank Group. Please be reminded – you alone are responsible for your trading – both gains and losses. There is a very high degree of risk involved in trading. The technical analysis, like any and all indicators, strategies, columns, articles and other features accessible on/though this site (including those from Signal Centre) are for informational purposes only and should not be construed as investment advice by you. Such technical analysis are believed to be obtained from sources believed to be reliable, but not warrant their respective completeness or accuracy, or warrant any results from the use of the information. Your use of the technical analysis, as would also your use of any and all mentioned indicators, strategies, columns, articles and all other features, is entirely at your own risk and it is your sole responsibility to evaluate the accuracy, completeness and usefulness (including suitability) of the information. You should assess the risk of any trade with your financial adviser and make your own independent decision(s) regarding any tradable products which may be the subject matter of the technical analysis or any of the said indicators, strategies, columns, articles and all other features.
Please also be reminded that if despite the above, any of the said technical analysis (or any of the said indicators, strategies, columns, articles and other features accessible on/through this site) is found to be advisory or a recommendation; and not merely informational in nature, the same is in any event provided with the intention of being for general circulation and availability only. As such it is not intended to and does not form part of any offer or recommendation directed at you specifically, or have any regard to the investment objectives, financial situation or needs of yourself or any other specific person. Before committing to a trade or investment therefore, please seek advice from a financial or other professional adviser regarding the suitability of the product for you and (where available) read the relevant product offer/description documents, including the risk disclosures. If you do not wish to seek such financial advice, please still exercise your mind and consider carefully whether the product is suitable for you because you alone remain responsible for your trading – both gains and losses.

Start price growthAfter the completion of a full Elliott wave, the price of the guard has started to rise strongly for higher goals

NKE 1/12/2022Daily Chart analysis
NKE has been in an uptrend since back in ’89 when your dad was rocking the fresh Jordan 4s.
Will look for possible long term buy entry.
Price was previously in a descending triangle and after making a series of lower highs into 167 support area, it broke down mid Dec. ’21.
From there, price proceeded to pullback to previous support where it bounced off turning it into a resistance level.
Price followed by falling into support area between 144-150 which once acting as a resistance level.
Currently, we have had back to back days that ended as doji candlesticks at support area with stochastic reading of oversold. This is my que to enter trade long.
Since we still have not broken any of the lower highs, I will be taking a swing trade to the down trendline above created by the lower highs.
Entry: 151
Stop loss: 143.50
Target: 163

NKE ShortNike is now under its support of $145 and under the 200sma while already testing it and using it as resistance, share/comment thoughts!!

NKE in a downtrend and possibly going to the gap fillLooking at NKE and seeing all kinds of bearish signs for the short term. It is currently under its 200MA and 50 MA, also below the 12 and 26 EMA (DAILY CHART)
Bearish case (short term)
This one is simple: A break below $144 could give sellers the chance to fill the gap created back on June 24th 2021
Below $144 I can see $138 being a real possibility if not the full gap to $134.82. Puts below $144 could work and be considered.
Volume is light. Less shares traded on 1/18 than compared to average volume of 5,815,975 shares
NKE has the demand on its product, but supply chain issues make it where they cant meet that demand. Earnings in March will paint a bigger picture as far as revenue and EPS
Bullish outlook (long term)
That said, I am short term bearish but long term bullish: "Guggenheim's Robert Drbul dubbed the athletic-apparel retailer his "best idea" for 2022 in a December 31 note, saying Nike "is rapidly embarking on the next era of its company history," which he expects to be "digitally led." "Drbul maintained a buy rating and a price target of $195 on Nike stock, which was down 1.8% Monday after gaining 18% in 2021." "Insider reported previously that Nike has been pushing into the future internet, called both Web 3.0 and the metaverse. Its push has included video games, the creation of a metaverse studio, and even a promised line of digital sneakers called CryptoKicks." I really like their effort to step into a newer market and expand. Nike is a staple brand that is not going anywhere. At 145 this stock is underweight.

Nike/USDHello Everyone
today we are going to a briefly review on #Nike
And some good points for buy and hold.
Best wishes to you.

NKE Forecast using GPT MethodThis is just to track a test going forward. Prices are calculated from major highs and lows.

NKE: Bad ER receptionBad ER reception on 24th of September.
Stock gapped down.
Expecting a drift down in the next 1-2 weeks as
longs cover and funds unload their positions.
Stock is also currently not making new highs
and trading below its 50 day SMA

NKE 1/3/20224HR chart analysis
Price has been in a descending triangle with multiple tops. On 12/14/21, price breaks down creating shorting play. Price suddenly reverses and makes a sharp move back into the descending triangle. Here we have our 1st Price rejection of lower prices making the initial breakdown from descending triangle a “false” breakdown. From here, price makes another attempt at the Resisting trendline but fails and makes another “lower high”. Price then follows to breakdown once again and falls below support. Currently, price is sitting close to the 200ema looking to reject lower prices and bounce back up into support for the second time.
Analyzing this chart, we can see there is a lot of seller action within this descending triangle. We have 5 tops forming a series of lower highs and we also have 2 breakdowns of the descending triangle. These are all areas where sellers took a position to short.
The buyers however have flashed their strength. When price broke down the 1st time, they were able to buy up the lower prices and bring it back into Support of the descending triangle. This made the initial breakdown a “false” breakdown as price went back into consolidation within descending pattern.
There should be no open trades going long right now. Price has broken down from descending triangle support creating another shorting opportunity. However, if price rejects lower prices for second time and bounces back into support, then this is a MUST buy. Buyers would show further strength creating higher lows with the 2nd price rejections. If the buyers can use this strength to break up and out of descending triangle, it will create massive buyer pressure due to all the previous seller activity within this descending triangle. A lot of seller stop-losses and exits will catapult the price.
If price bounces back into area of value @ Support, the long trade “risk to reward” wise makes this a no brainer trade.
Entry: Buy order @ $167. Area of Value
Stoploss: $162.50(-2.69%)
Target exit: TBD

A Trend-Reversal for Nike expected!A lot of analysts are pretty sure that NKE is a solid long-term investment. But in the past week and a half, there was a huge price-drop.
and the latest daily candles don't look too promising ... three Dojis and a red candle - pretty indecisive.
But there is a bullish Signal - a bullish Divergence of price vs CCI.
Looking at the past two bullish CCI Divergences, both were followed by huge gains. And now RSI is oversold, so maybe a good time to go long with NKE.

NKE 1/12/20225 min Chart analysis
Day trade idea
NKE ranging between 147-150.
Price broke out and pulled back to support. This is my entry.
Entry: 151.70
Stop loss: 149.70
Target: trail 10ema


potential dip entry for a quick swing? ⛸nike sitting above what use to be extreme resistance, the last dump we actually tested the support then bounced.
We could make a higher low based off the last dump and continue higher to 155.8-163.15. Must hold this support though!
like and follow for more 💘

$NKE - At level of interestJan 10. $NKE.
$NKE with a huge gap down today with the market. And it is right on my level of interest. I'm looking for it to either find support here and move back up or go down a bit, retest this level and go for $145 area and below.
If it heads back up from here, I will go long.
Or I will go short if it retests this level in the next few days and falls back down.


NKE Potential Double Top - What's Next?Description
NKE has now rejected the 175 level for the third time, now I am tracking this Descending Triangle consolidation pattern.
This could be a Double-Top pattern in the making, although the Double-Top is notoriously difficult to track, and nearly never confirmed until long after is has finished it's formation.
Evidence indicative of the usual Double Top:
Two tops at approximately the same level, but more than a month apart
Somewhat less activity on the second advance than the first
Dull or irregular, rounding-type of recession between them
It is noted that should a small H&S or descending triangle occur at the second top, long commitments should be protected with a tight stop, or switched to a more promising chart picture.
In NKE's chart,
we see two Tops at approximately the same level (within 3%), and approximately 3 months apart, which is a strong indication that this is not a normal congestion or consolidation pattern.
Slightly more activity can be seen on the second advance than the first, and there is distinctly low activity throughout the entire pattern.
The recession between the tops marks one of the only increases in activity in the entire pattern, taking place perfectly at the last known resistance around 145, and marked with a large gap down following the earnings report on 23SEP.
At the second peak, NKE is currently undergoing some type of consolidation that appears to be a descending triangle with irregular volume.
What, in picture, appears to be a "Descending Triangle" has highly irregular volume throughout and could potentially be portrayed as a Falling Wedge.
The Descending Triangle has bearish implications, while the Falling Wedge has bullish implications.
Although the volume displayed is not conducive to either formation, it could be explained by high volatility in the indexes.
With these things in mind, I believe the best position to put on is a 3-month Straddle.
The options market right now is implying about a 14% move in either direction in the next 3 months, so any expiration beyond 146 or 194 would be profitable in that time period, with the last potential support being at 143 for the downside, and all-time highs to the upside.
I, however, will be putting on a directional play based off of where I think the indexes are heading:
Long Put
Levels on Chart
SL > 175
PT : 150
*Stops based off underlying stock price, not mark to market loss
The Trade
BUY
01/07/22 155P
R/R & Breakevens vary on fill.
This put generates a good breakeven in advance of the 145 support if held until expiration.
If you would like me to build the Straddle or build a Strangle, just ask.
The Strangle will create a cheaper position, but push the breakevens further away from the current stock price.
As always, time will tell
Manage Risk
Only invest what you are willing to lose

Short NKE NKE looks to have topped already. pattern i showing a move low. would like to see the trendline and 38 break for confirmation
Not financial advice
