NKE- Run !Welcome back to another dow30 stock analysis, today we take a look at Nike. NYSE:NKE
Nike is currently breaking high after high and there is still no end in sight!
As an example, nike gained more than 125% stock value since the bottom of the march crash.
It should be no surprise that everybody wants to participate in this rallye, but being careful in this situation is very important.
Nike formed a solid 1-2 in the last days and hit exactly the 0.618 retracement, this strongly points towards the start of a wave 3.
The next stop for nike will be 140$-150$, there we will see a short correction.
I will watch the market very closely in the next days and will announce an entry if i get the chance to.
Primary scenario:
In the next days and weeks we will reach prices above 140$ or even more, so stay tuned!
From there we will witness a very short wave 4 correction until the bulls push nike towards a new ATH.
Alternative scenario:
My alternative scenario will get triggered if we break the previous 1-2 setup at 125.55$.
Breaking this level would strongly indicate for a final wave C correction, which could bring us to prices as low as 110$.
===================================================================================================================
If you have questions related to a specific stock or the Elliot Wave theory, feel free to contact me.
NKE trade ideas

Safe CallNike is a safe stock to bet on if you are an options swing trader like myself. It has just hit resistance on the 45min while the MACD shows an upward trend and increase in bull strength. We are in a bull market and calls are much safer than puts for any stock.
I have lost a lot of money on puts, even on stocks with the highest RSI and strongest sell signals across all indicators. Check out my ROKU publication and you will know what I am talking about.
My question to all my followers, and those who see this because you are watching Nike.
Why are markets soaring so high? What is the cause of such a strong bull run? Where is this money coming from?
All this from a cure to Covid? A virus that the media has reported so strongly and ingrained fear into everyone, even though the common flu is just as deadly, and the annual death rate has remained constant compared to previous years.
Where is this coming from?

NKE - Good swing ER runNKE - Respecting trend line and about to reach all time high, Elliot wave 3 target 150, with ER on Dec 18 expecting this to reach this target and always watch out if any trend line break for bearish too, stop loss if dropped below 130-125
Looking to enter - 12/18 - 145c - 0.9
Note : Please do make your own analysis before entering the trade
- NV

NKE - Bullish after Rising Wedge Drop to $130NKE
Today: 11/28/20 6pm PST
Plan: Rising Wedge, let NKE fall to Price Line 130.50$/around fib 618, buy and rise, sell before 786 fib.
Price line 130.50$ is a strong resistance all of Oct, but has acted as support recently on Nov 19. Nike is spiking based on earnings, there is no major new to drive the price from current up to the fib 1 area. Expect a small drop, and pick it up as Nike resumes it's regular zone trading.

$NKE Bearish Swing Trade PlanGreen Line - Entry Target
Red Line - Exit Target
Pink Line - Stop-Loss
Highly suggest using Google to Search "Transparent Traders" if you're trying to get to the next level.
Transparent Traders exists to solve the critical issues facing our traders, both large and small. Our unique approach is not only what differentiates us, but also what makes us successful.
Our advanced Blackbox uses custom algorithms & predictive A.I. to locate the most accurate day or swing trades for the best chance of success.


NKE Needs To Fall $3 MoreI'll let the chart do the talking!! Just need NKE to continue its trend and fall another $3. I am up big on my position!


NKE Long1) BO resistance, pending BO ATH resistance
2) Volume high
3) Bright green histo
4) MACD upward
Meanwhile Daily:
1) BO
2) Buying volume coming in
3) Long squeeze
4) Bright green histo
5) MACD golden cross
6) Bright green histo


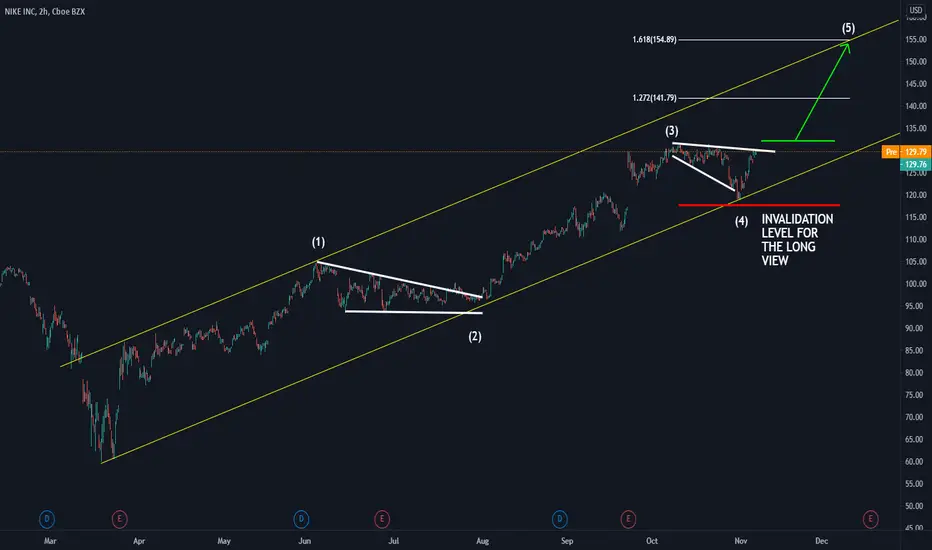
NIKE inside an ascending channel. Potential for another waveToday we will share an analysis of NKE. This can be used as a curiosity or to create a setup with an appropriate Risk Reward Ratio towards the Target.
Main items we can see on the chart:
a) The price is inside an ascending channel providing a bullish context
b) Currently, we can see a clear corrective structure with similar proportions as the previous one
c) Using Elliott Wave theory we can make a count 1234, and we expect 5 to come (Remember that Elliott defined that 5 waves will compose any impulsive movement)
d) We expect a bullish movement towards the higher zone of the ascending channel
e) Also, we have an invalidation level in case the price does not go in the expected direction
f) Remember: Trade safe, protect your capital, and always understand what you are doing!
"NKE Long" Bullish will this be able to breakout & push to $139NYSE:NKE Nice pull back and a reclaim of the lower range of 126.31 would like to see if this can get some nice momentum to pop that 131.38 spot so see if this can get going after that all time high breakout to make the run towards that 139.15 spot.

Nike reaching for new HighsNike is getting ready to break into new high territory after filling a gap and closing back above the 21d EMA.
The ATR calls for a tighter stop of 118.01 (7.33% below today's close).
Position Size of R13.64.

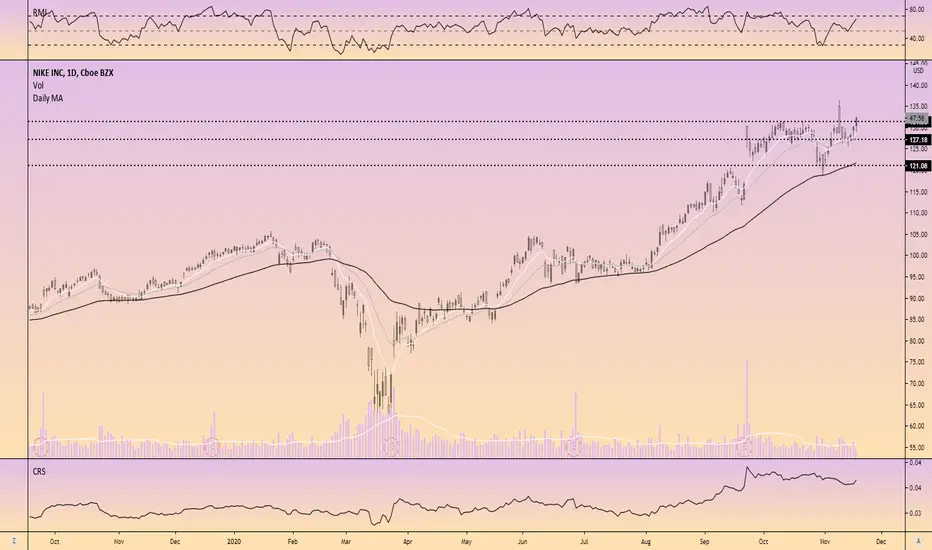
How To Trade Stocks with Volume Profile (NIKE Analysis) 👟In today’s analysis, I will give you a quick guide on analyzing and trading stocks with Volume Profile.
I am going to focus on long-term investments, not day trading.
NIKE – Volume Profile analysis
What i really like about Volume Profile is it’s versatility. You can use it for almost any trading instrument and the best thing is that you always do it the same way. The strategy and setups are the same regardless of what you trade.
In this case I did my analysis on Daily chart (you can also do this on Weekly).
From July to August the price of Nike was in a rotation. The price created a flag and the rotation was becoming tighter and tighter.
The tighter the rotation becomes, the higher chances it will shoot aggressively up or down from there.
And this exactly this happened in the beginning of August. The tight price channel broke, and the price shot upwards, starting a new trend.
NIKE – Point Of Control (POC)
I used my Flexible Volume Profile to look inside the rotation area to see how the volumes were distributed there.
It showed that there were massive volumes traded in that rotation, and that the Point Of Control (place with the heaviest volumes traded) was at 98.00. This is an important information because this is the place where most of the trading took place.
I expect that the big trading institutions (banks, hedge funds, pension funds,…) were building up their massive Long positions there.
When they finished doing so, they started to push the price aggressively upwards into a new uptrend.
When the price makes it back and tests the POC at 98.00 I think that those big institutions will become active again and that they will drive the price upwards again.
POC is very important level for them because they have placed most of their positions there. They will defend it, and for this reason it should work as a strong Support.
So what now? Now we wait until the price comes back to 98.00. You can set a pending order there, so you don’t miss the trade entry when the price makes it to 98.00.
I hope you guys liked the article. Let me know what you think and if you are into trading stocks or if you prefer currencies, futures, or something else.
Happy trading!
-Dale

NKE to break higher on technicals and earningsNike had a good earnings report this past quarter beating over 100% of the analysts' expectations on some strong volume too. We can see the potential of the break of the top on these higher lows as well.
The current resistance is at $130-$131 where we have see the level get tested time and time again on strong bullish momentum and candles, meaning whoever is stopping form price moving through that level has a lot of stops hidden above. That buy stop run could open up price aggressively to the first target at $145.00 or so.
There is the possibility we pullback to close the gap or into the $123 support too before rocketing higher. The higher probability move is the breakout though. With the potential Santa Claus rally coming through and the elections resolving some of the uncertainty in the market, it would see that retail especially online retail may get a nice push this year due to quarantine as well.
This idea is for educational purposes only, should not be taken as investment advice or trading advice.

$NIKE Potential day Trade
NIKE on the verge of making the next move higher.
Alert set for $131 .
Upside target $134-$136 short term


Nike Bullish keatas dengan Parabolic PatternNike menunjukkan Gap Up sebanyak 3 kali menandakan market masih lagi bakal menerukan kenaikan untuk membentuk parababolic pattern

nike expection move 80%the macd and bull pattern
the fibo expection 0.618
like share and follow if it was usefull

NKE/Nike has BUY positionAs you can see after breaking those purple areas, Its a good entry point, but price might have some struggles after reaching the second purple cluster. So after breaking it, it would be another good entry point.
