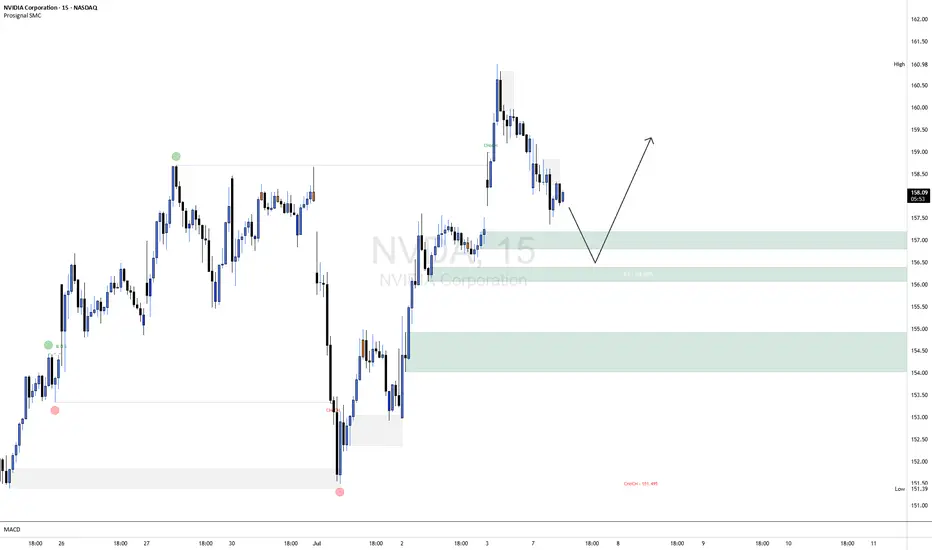
NVDA ShortNVDA is currently exhibiting short-term bearish order flow on the 15-minute chart, with price making lower highs and lower lows following a clear CHoCH (Change of Character) to the downside. The current leg suggests continued weakness as price retraces toward the highlighted bullish order block around the 156.20–157.00 range, aligning closely with the 50% equilibrium level of the last bullish impulse.
This area represents a high-probability demand zone where we anticipate a potential bullish reaction. A confirmation entry (e.g., bullish BOS or lower timeframe CHoCH within the OB) will be required to validate a long setup from this zone. Should confirmation present itself, upside targets can be trailed back toward recent highs near 159.00–160.00.
Risk Management Note:
Always wait for confirmation before entering against the prevailing short-term trend. Use a well-defined stop-loss below the order block and calculate your position size based on your overall risk tolerance (typically 0.5–1% of account equity per trade). Avoid overleveraging, and remember that patience and discipline are key to capital preservation.
NVDA trade ideas
NVIDIA to $228If Nvidia were truly done for, why is it impossible to find their latest 5000 series GPUs?
Even if someone wanted to buy one, they simply can't.
The reason lies in Nvidia's commitment to fulfilling the soaring demand from AI data centers, which has left them unable to produce enough H100 and H200 models.
This situation also allows Nvidia to increase their profit margins significantly, capitalizing on the disparity between demand and the media frenzy surrounding them.
DeepSeek serves as a prime example of how out of touch mainstream media can be.
All DeepSeek did was replicate Chat GPT.
Training models requires substantial computing power. The panic surrounding Nvidia and other semiconductor companies is quite amusing; the demand for computing power is skyrocketing!
The gap between the reality of the AI mega-trend and the narrow focus of mainstream media is staggering! It's astonishingly out of touch! Just as out of touch as Cramer was when he declared META was done at $100, or when he thought Chat GPT would obliterate Google at $88.
Stock prices fluctuate between being overvalued and undervalued. While we have metrics like EGF and PE ratios to assess valuation, indicating that Nvidia is currently inexpensive, this doesn't guarantee it won't drop further. However, it is generally wiser to buy stocks when they are cheap rather than when they are costly.
The greater the deviation from the high then the greater the BUYING OPPORTUNITY being presented for the very best leading companies.
The key takeaway is that the deeper Nvidia falls during its corrections, the more advantageous it could be.
Those who are experiencing anxiety during these declines may find themselves selling at a loss, or for a marginal profit possibly around previous highs, while the stock has the potential to rise to $228 and beyond.
The potential for growth is significant; the $228 Fibonacci extension may not represent the peak. Attempting to predict a top for Nvidia could be misguided. Once it reaches $228, Nvidia might maintain a valuation similar to its current $130 level.

NVDA at Inflection Point: Reclaim $158 or Fade to $150?NVDA at Inflection Point: Reclaim $158 or Fade to $150? Monday Setup Ready 📉📈
🧠 GEX-Based Options Sentiment:
— The $158.71 level is the highest positive GEX zone and aligns with the 2nd CALL Wall. This is the strongest gamma resistance — the level to beat.
— $157.50 is the 3rd CALL Wall (7.99% GEX) and has acted as a ceiling — NVDA is currently pinned underneath.
— Below, $152.50 to $150 forms a GEX magnet zone, where price is likely to gravitate if weakness sets in.
— The $149 HVL zone also aligns with this gamma pocket, making it a strong downside target.
— Implied Volatility Rank (IVR) is very low at 6.8, which makes options cheap — ideal for buying directional calls or puts.
— Call flow shows a moderate bullish lean (5.4%), but nothing extreme. No signs of a major squeeze — yet.
🔧 Options Setup for Monday–Wednesday:
Bullish Trade Idea:
If NVDA breaks and holds above $158, consider buying a CALL debit spread, such as 158c/165c expiring July 3 or July 5.
Target zones would be $160 and $165 based on GEX7 and GEX6.
Stop-loss would be a move back under $157, especially on rising volume.
Bearish Trade Idea:
If NVDA fails to reclaim $157 and breaks below $155, consider a PUT or a PUT debit spread. 155p to 150p (Jul 3 expiry) would be the play.
First target is $152.50, followed by $149.
Stop if price recovers $157.50 with strong bid.
📉 Intraday Technical Breakdown (1H Chart):
The structure shows clear signs of weakening strength.
— NVDA had a confirmed BOS, but now it’s printing a CHoCH just under the trendline and inside a supply zone.
— Price rejected multiple times near $158.
— Volume spiked into the Friday close but did not confirm breakout — more likely to be profit-taking or gamma hedging.
— The short-term trendline has been broken, and bulls are defending the structure weakly.
📌 Key Intraday Levels to Watch:
— $158.71: Gamma ceiling and major supply zone. Break above this can lead to a squeeze.
— $157.00: Local resistance from Friday.
— $155.02: BOS level and key decision point.
— $152.50–150.00: Gamma magnet and thin volume shelf — likely destination if price breaks.
— $149.00: HVL zone and major demand.
✅ Thoughts and Game Plan:
NVDA looks vulnerable to a fade if bulls fail to reclaim $158 early in the session. It has rallied sharply the past week and is now stalling beneath gamma resistance. The CHoCH under trendline shows supply defending. If Monday opens flat or slightly weak and price stays under $157.50, I expect bears to press it toward $152.50 quickly, maybe even $149 by midweek.
But if buyers step up and push a reclaim above $158.71, the next gamma wall is at $160–$165 — that’s where a breakout can accelerate. In that case, the IV being cheap favors buying calls.
Be patient and don’t front-run Monday open. Let price confirm. The best edge here comes from reacting to the key levels — not guessing them.
Disclaimer:
This analysis is for educational purposes only and is not financial advice. Always do your own research, trade your plan, and manage risk accordingly.

Long Probably!Hello All. because of No Pre-Cluster, market will reverse on the Node on versa Cluster. be happy(wink)

NVDA DECISION TO MAKE watching NVDA on breakdown or failure of breakdown Harmonic. increased volume at double bottom and D PRZ suggests to me this will not breakdown, but i dont think it wont chop away my confidence either. ill just wait for the direction.

NVDA Heating Up: Gamma Walls Hint at 150+, Is This the Breakout?
📊 GEX Options Sentiment – Bullish Setup
The GEX (Gamma Exposure) landscape for NVDA shows strong bullish pressure:
* Highest Positive GEX & Gamma Wall at $147.80, which NVDA is testing now.
* Call Walls stacked at:
* $148.00 (59% GEX7)
* $149.00 (76.85% GEX8)
* $150.00 (76.23% GEX9)
* IVR: 1.7 (low implied volatility)
* Calls $%: 5.8%
* Sentiment: 🟢🟢🟢 (bullish)
This zone between 147.80–150 is a high-confluence area for a gamma squeeze, especially if NVDA can push and close above 148.00.
✅ Options Suggestion:
Consider 146C–150C (6/28 or 7/5 expiry) if NVDA reclaims 147.80 cleanly with volume. Low IVR makes this attractive for directional plays.
📉 1H Trading Plan – Price Action Analysis
On the 1H chart:
* Structure: Clean Break of Structure (BOS) after reclaiming previous resistance near 145.
* Current price is consolidating in a small supply zone (purple box) at highs.
* Trendline support from June lows is intact.
* Previous CHoCH levels and demand zone between 142–143 remain unbroken — a bullish structure.
Trade Scenarios:
🔼 Bullish Breakout Setup:
* Entry: Above 148.00 breakout (watch for volume confirmation)
* Target: 149.50 → 152.00 → 154.00 (top GEX zones)
* Stop: Below 145.00 (invalidates the breakout)
🔽 Bearish Fade (Only if rejection):
* Entry: Rejection from 148.00 with high volume + failed reclaim
* Target: 145.00 → 143.50
* Stop: Above 148.50
🎯 Final Thoughts
NVDA is sitting right under its gamma squeeze trigger. A breakout above 148 backed by GEX momentum could see a quick move toward 150+. This is a high-conviction zone — but don’t chase blindly. Watch price action around 147.80–148.00 for confirmation.
This analysis is for educational purposes only and not financial advice. Trade at your own risk and always use proper risk management.

$NVDA 6/27 exp week; $150 calls. Quick ChartHello. Market is moving up off the “news” of “ceasefire” from Trump. Take what is given I suppose. NASDAQ:NVDA could see a beautiful upside towards the psych level of $150 in just one session (Tuesday, 6/24) which is just a “small” move of 3%. Could break out of its rising wedge. This name has been lackluster as of late (kinda sorta). $150 calls will be entered at open (6/24) and my first target will be $148.98. There are multiple rejections at these levels. Good luck!
WSL

NVDA GEX Zones + Price Setup: Big Move Loading? Jun 24
🔍 Market Structure Overview (15m + 1h Combo)
* NVDA showed bullish BOS and CHoCH structure earlier today, reclaiming mid-range after tapping demand.
* The current CHoCH (purple box) is forming just under the $145 rejection area.
* A strong bounce off the green OB demand box around 142.00–142.04, holding this zone keeps upside potential alive.
* The upward trendline still valid unless we break under the green demand zone.
📊 GEX + Options Sentiment (1H Chart)
* Highest Net GEX / Call Resistance: $147 — strong resistance area.
* Second Call Wall: $148
* Gamma Wall Confluence: $146.20–147 zone –> expect rejection or a squeeze trigger.
* Put Walls: 140 / 139 / 138 — stacked gamma support.
* IVX avg: 37.4 (low volatility), IVR: 0.4 → cheap premium environment.
* CALL bias: 7.2%, 3 Green Dots = Bullish Bias w/ room to run.
🧠 Smart Money Concepts (15m)
* BOS to upside already confirmed.
* New CHoCH forming within a micro consolidation zone between $144–$145.
* Price is currently dancing around mid-supply zone.
* Liquidity still resting above 146.20, creating fuel if breakout sustains.
📌 Trade Scenarios
Bullish Case:
* Trigger: Break and hold above 145.00
* Target 1: $146.20 (first resistance)
* Target 2: $147–$148 (Call Wall + Net GEX)
* Invalidation: Break below 143.00
* Optional Call entry: Above 145, SL below 143.80
Bearish Case:
* Trigger: Rejection at $145 + CHoCH breakdown confirmation
* Target 1: $142.00 (Demand OB)
* Target 2: $140 (PUT Wall)
* Put entry: below $143.50, with volume surge and failed retest of 144
🎯 Final Thoughts:
NVDA is building energy in a tight CHoCH range. A push above $145 opens the gate to a gamma squeeze into $147+. Watch the reaction at 144.78 and 145 zone closely — it’s make or break. Under 143.00 and this flips bearish fast.
This analysis is for educational purposes only and does not constitute financial advice. Always do your own research and manage your risk before trading.

$NVDA has topped, new lows incomingNVDA has now topped, you can see that we've just formed another high time frame lower high and the rejection up here has the potential to create a strong bearish move.
I think it's very likely that the bearish move will take us all the way down to the bottom support before it's completed.
The bounce from the bottom went higher than I initially thought it would (which is why I'm creating a new chart), but price can't escape gravity and the same outcome is inevitable.
Let's see how it plays out over the coming weeks.
NVDA at a Decision Point! (June 24–28)NVDA at a Decision Point! Gamma Walls and CHoCH Setups in Play 🔥
🔍 GEX Analysis (Options Sentiment Overview)
* Current Price: 143.85
* Key Gamma Levels:
* GEX Support Zone: 140 → 141 (Major PUT Support with -28.46% positioning)
* PUT Wall Zones: 139, 138 (risk of acceleration below 140)
* Resistance Above: 146 → 149 range (Highest positive GEX @ 150, dense CALL walls up to 155)
* GEX Interpretation:
* Above 146: Triggers a mild-to-strong positive gamma squeeze potential. Clear air to 150 → 155.
* Below 141: Exposes NVDA to negative gamma drift toward 138 and possibly 134.
* Sentiment Metrics:
* IVR: 3.9 (Extremely low)
* IVx avg: 43.6
* Options Skew: Call $ flow only at 4.5% → suggesting lower speculative bullish bets currently.
📈 Technical Structure – 1H SMC Breakdown
* Trend: Currently in a consolidation range with a breakdown attempt under ascending channel and CHoCH shift.
* CHoCH Confirmed: Multiple bearish CHoCHs signal change of character at the highs.
* Rejection Zone: 145.48 → 146.20 (purple supply zone holding)
* Support Demand Zone: 140.86 → 142.20 (green box below where buyers may defend)
* Break of Structure (BoS): Under 143.13 opens the door to revisit lower demand zones.
⚔️ Trade Scenarios
🟩 Bullish Scenario
* Entry: Above 146.20 reclaim (post-break and retest)
* Target 1: 149.00
* Target 2: 150.50 → 155.00
* Stop Loss: Below 143.50
* Confluence: Gamma squeeze + reclaim of CHoCH rejection = fuel to upside
🟥 Bearish Scenario
* Entry: Breakdown below 143.13 with confirmation
* Target 1: 141
* Target 2: 138
* Stop Loss: Above 145.50
* Confluence: Bearish CHoCH + gamma wall at 140 could act like a magnet
📌 What to Watch
* GEX Pivot: 146.20 → Key reclaim level to watch early week.
* Volume Clues: Last drop had strong volume surge → If it sustains below 144, favor bearish flow.
* Intraday Bias: First retest of 144 → 145 zone may be a short opportunity unless bulls absorb and flip structure.
💡 Quick Thoughts
* NVDA is stuck in a high-volatility zone between a strong CALL wall cluster above and PUT support danger zone below.
* If macro or SPY drags, the 140 wall could get tested quickly.
* On the flip side, a reclaim of 146.20 is an easy trigger for bulls to squeeze to 150 and potentially 155.
📉 Bias: Slightly bearish unless bulls reclaim 146.20 and hold.
🎯 Most Important Level This Week: 146.20
Disclaimer: This analysis is for educational purposes only and does not constitute financial advice. Always do your own research and manage your risk.

Nvidia - Weekly Volatility SnapshotGood Afternoon! Let's talk NASDAQ:NVDA
Last week we saw HV10 (24.96%) increase above HV21 (23.67%) after starting what could be a regression towards HV63 (39.13%). IV (37.37%) entering this week reflects within 6% of it's sliding yearly lows and resonating around quarterly means. This could be showing a fair prediction to the regression potential and a volatility spike.
Here, the RSI has room but is elevated and hinged down with the MACD crossed red -- lagging indicators showing trend reversal. If bi-weekly values can find regression to quarterly; the implied range I would be watching is $135.47 - $148.47 with IV increasing affecting premium positively. If the grind up continues slowly, expect IV to melt and be watching for contracting HV10 ranges between $137.82 - $146.12 -- Keep an eye on the news, it will ever affect the broader markets and any underlying within.
Follow along through the week as we track our volatility prediction -- I will pull the charts back in at the end of the week to review!
CHEERS!

NVDA might want to check this out.Been on a great run... whatever it's holding on to looks like it's about to break. So much negative divergence.

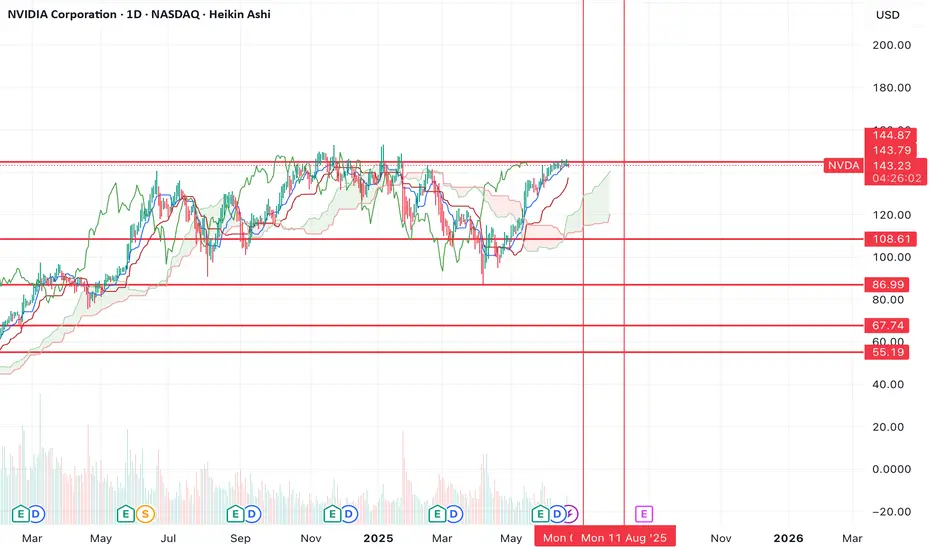
NVIDIA – Best Buy of the Decade (2 Years from now) 🚀💻 NVIDIA – Best Buy of the Decade (2 Years from now) 🔥🧠
Hey everyone! Back in 2021, I called NVIDIA the best buy of the decade, and in 2023, we followed up as NVDA rocketed to my target of $143. Now in 2025, it’s time for Part 3 — and the case for NVDA being a generational play just got even stronger. 💪
✅ On April 4th, I re-entered around $96.85, right at my alert level. The setup? A rounded bottom reversal pattern forming with 4 strong bullish divergences on key indicators (Stoch, CCI, MOM, MFI). Target levels ahead:
📍 $143
📍 $182
📍 $227
📉 Yes, Nvidia took a 6% hit after announcing a $5.5B impact from U.S. export restrictions on its H20 chip to China — a reminder that macro & geopolitical factors still matter. But…
💡 The company just launched DGX Spark and DGX Station, bringing AI supercomputing to the desktop — powered by Grace Blackwell architecture. That’s next-level innovation, not just for enterprises, but for developers, students, and researchers alike. A true desktop AI revolution.
🇺🇸 And most importantly: NVIDIA will now manufacture AI supercomputers on U.S. soil — in Arizona and Texas — aiming to produce $500 billion worth over the next four years. This initiative is a bold move toward supply chain resilience, economic growth, and cementing NVIDIA’s leadership in the AI arms race.
⚠️ If we lose the $96 level, I’ll re-evaluate. But for now? The technical and fundamentals still say: Best Buy of the Decade (2 Years from now we will revisit this chart).
💬 What’s your outlook? Are you buying the dip or waiting on clarity?
One Love,
The FXPROFESSOR 💙

NVIDIA (NVDA) – Ending Diagonal at the Top? 126 Next?NVDA is currently trading inside a potential ending diagonal, often signaling a reversal or strong correction. With multiple Breaks of Structure (BoS) and a visible Fair Value Gap (FVG) left behind, this setup is aligning with Smart Money Concepts.
📉 Bearish Rejection Expected?
Price might sweep liquidity and revisit the 126–129 demand zone, where strong unmitigated orders sit. If this zone holds, a bullish continuation toward 152+ is likely.
🔍 Key Highlights:
⚠️ Ending Diagonal pattern near local top
📊 Multiple BoS confirming internal structure shifts
📉 Unfilled Fair Value Gap (FVG) near 129
🟩 Strong demand zones at 129–126 and 108
🔄 Potential liquidity sweep before reversal
🧠 Smart money footprint visible
📅 Watch for price reaction around 129.8–126.1.
📈 Breakout above 145 with strength may invalidate the drop.

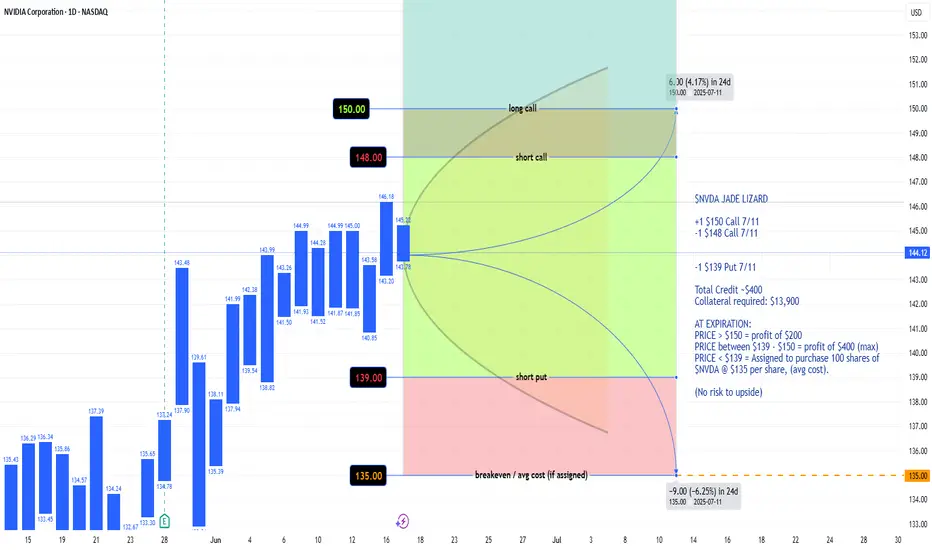
$NVDA JADE LIZARD 7/11 expirationNASDAQ:NVDA JADE LIZARD
+1 $150 Call 7/11
-1 $148 Call 7/11
-1 $139 Put 7/11
Total Credit ~$400
Collateral required: $13,900
AT EXPIRATION:
PRICE > $150 = profit of $200
PRICE between $139 - $150 = profit of $400 (max)
PRICE < $139 = Assigned to purchase 100 shares of NASDAQ:NVDA @ $135 per share, (avg cost).
(No risk to upside)
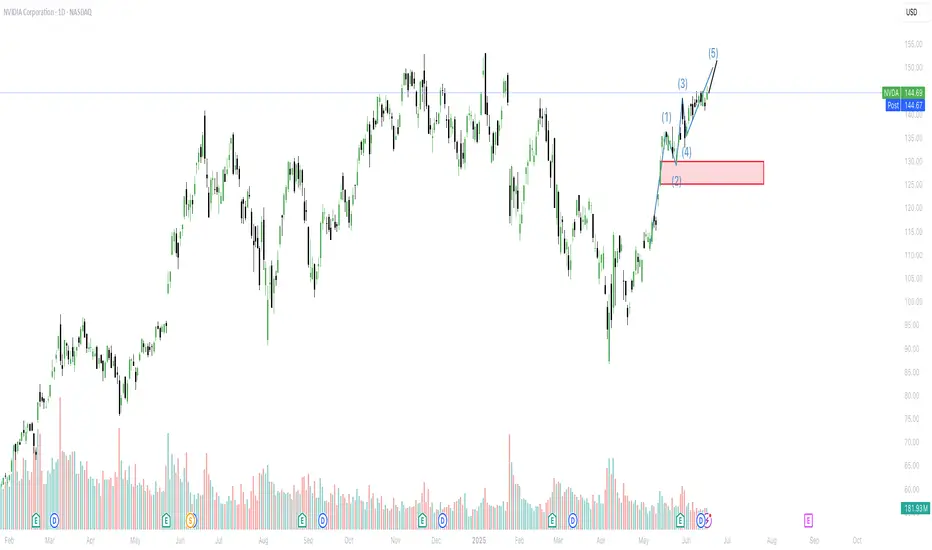
Nvidia (NVDA) Wave 3 Close to ConclusionSince July 4, 2025, Nvidia (NVDA) has been experiencing a robust rally. The rally is unfolding as a five-wave impulse structure according to Elliott Wave analysis. This upward movement began at a low on July 4, 2025, with wave (1) concluding at $115.44. A subsequent pullback in wave (2) found support at $95.04. This sets the stage for the ongoing wave (3), which has developed as another impulsive subdivision.
Within wave (3), the stock advanced in wave 1 to $111.92. A brief dip in wave 2 then followed to $104.08. The momentum resumed in wave 3, pushing the stock to $143.84. Afterwards, a corrective wave 4 settled at $132.92, as observed on the 30-minute chart below. Currently, Nvidia is advancing in wave 5 of (3). This wave has seen wave ((i)) peak at $144, followed by a pullback in wave ((ii)) to $137.88. The stock then surged in wave ((iii)) to $145, with a minor correction in wave ((iv)) completing at $140.46.
Wave ((v)) higher should end soon, concluding wave 5 of (3). Following this, a larger-degree wave (4) correction is expected, potentially unfolding in a 3, 7, or 11-swing pattern. This pullback should precede a final ascent in wave (5), completing the cycle from the July 4, 2025 low.

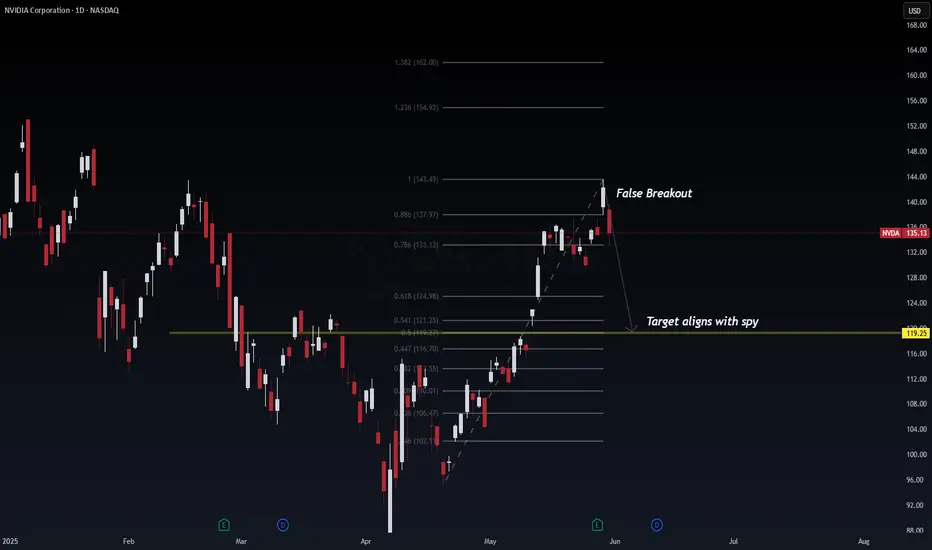
NVDA (NVIDIA) False Breakout and Synchronized Pullback with SPYNVDA printed what appears to be a false breakout at the 1.0 Fib extension level ($143.49), now reversing sharply — potentially aligning with SPY's projected retracement. This presents a high-probability mean reversion setup.
📉 Technical Breakdown
Current Price: $135.13
False Breakout Zone: 1.0 Fib extension ($143.49)
Key Breakdown Zone: 0.786 Fib ($133.12)
Probable Retest Zones:
0.618 Fib: $124.98
0.5 Fib: $121.25
Target: $119.25 (confluence with SPY's demand zone)
🔍 Probabilistic Trade Outlook
⚠️ False breakout + bearish engulfing = 80% probability of continued downside.
📉 Targeting $119.25 = 65% probability as it aligns with institutional levels and SPY’s projected retrace.
💡 Volume and momentum suggest profit-taking and supply absorption.
🌐 Macro Context (May 31, 2025)
AI bubble cooling: Rotation from AI mega caps into broader market value plays.
SPY & NVDA correlation: NVDA typically leads tech-heavy indices — the confluence here could signal broader market pullback.
Fed Policy Uncertainty: No rate cut priced in for June; July will be key.
🧠 Institutional View
This setup echoes the "buy-side trap" — liquidity engineered above previous highs, now reversing to collect resting orders below. This is textbook Smart Money Concepts (SMC) in play.
🧭 Trade Setup
Entry: On confirmed breakdown below 0.786 ($133.12)
Target: $119.25
Stop: $143.60 (above fakeout zone)
Optional Re-entry: Near 0.618 ($124.98) on confirmation
📌 If NVDA hits the $119–121 zone in confluence with SPY’s bounce region, a high-R:R reversal trade may follow.
#NVDA #FibonacciLevels #SmartMoney #LiquiditySweep #TechStocks #MarketReversal #AIStocks #TradingView #WaverVanir
How many times we need to get 1000%+ on this? Here's 3 more...NASDAQ:NVDA
We are currently trading above a significant Fibonacci retracement level of $143. We want to see price consolidate above $145, where we will target $194-$200 next. There are several ways to trade this from here.
* Short-term range from $145 to $150
* Breakout momentum trade over $153 targeting $193
* Long-term range between $103 to $140

NVDA at Gamma Cliff! Will Buyers Defend $143 or Drop to $140?🔬 GEX (Options Sentiment) Breakdown:
* Key Gamma Levels:
* CALL Walls / Resistance:
* $146.18 = Gamma Wall (currently rejected)
* $148.84 → 2nd CALL Wall
* $150+ = Higher GEX levels but unlikely short-term without breakout
* PUT Support Zones:
* $143 → active support (currently being tested)
* $140 → key gamma flip zone (GEX8)
* Below $140 → $138 / $135 → deep gamma pit
* GEX Metrics:
* IVR: 2.6 (extremely low = possible vol expansion coming)
* IVx avg: 38.8
* Calls Flow: 7.9% (weak call interest)
* GEX Sentiment: 🟢🟢🟢 (neutral-to-bullish positioning)
* Interpretation:
* NVDA is struggling at $146–147 gamma wall — rejection could cause dealer de-hedging toward $143 or even $140.
* IV is extremely suppressed → any large move could expand volatility and create rapid price shifts.
📊 15-Minute SMC Chart Breakdown:
* Current Price: $145.20
* Structure:
* Price broke bullish structure early session and reached supply near $146.18 → then CHoCH triggered at the top.
* Now pulling back into a minor demand box ($143.68–144.27).
* If demand fails here → eyes on deeper demand at $141.97 and $140.86.
* Major volume spike on pullback shows institutional selling near top.
* Trendline:
* Broke rising wedge → momentum flattening.
* Volume divergence (price up, volume down) followed by breakdown = warning.
🧭 Trade Setups:
🟥 Bearish Setup:
* Trigger: Break below $143.50
* Target 1: $141.97
* Target 2: $140 (GEX zone)
* Stop-loss: $146.20 (back inside supply = invalid)
Dealers could unwind hedges if price stays under $144, accelerating toward gamma-supported downside.
🟩 Bullish Reclaim Setup:
* Trigger: Reclaim and hold $146.20
* Target 1: $148.84 (2nd CALL Wall)
* Target 2: $150+
* Stop-loss: $143.60
This would trap late shorts and could cause a gamma squeeze toward $149–$150.
🧠 My Thoughts:
* NVDA is at the inflection, sandwiched between dealer defense at $146 and GEX vacuum under $143.
* If SPY/QQQ break lower tomorrow, NVDA could lead downside toward $140.
* Volatility is cheap (IVR 2.6), making options attractive if directional bias is strong.
* Ideal trade: wait for confirmation at $144–143 area before entering PUTs.
📌 Conclusion:
NVDA is showing short-term weakness under heavy gamma resistance at $146. A clean breakdown below $143.50 opens the door to $140 fast. Only a reclaim above $146.20 flips bias bullish again.
Disclaimer: This analysis is for educational purposes only. Always trade your own plan and manage risk accordingly.

NVDA 15mins Short Market Context:
After a corrective decline, NVDA is showing temporary bullish momentum, forming higher lows on the lower timeframes. However, the overall structure remains bearish-biased, and this upside is likely part of a liquidity run rather than a genuine reversal.
Liquidity Magnet at $149
There is resting liquidity above recent highs near $149, a zone where retail buy stops are likely positioned.
Smart Money typically pushes price into such highs to induce late longs and liquidate early shorts before a major move.
Momentum Shift Already in Progress
The current bullish move lacks aggressive expansion — it's showing divergent momentum and weaker impulse candles compared to the prior leg down.
This signals the upside may terminate as a liquidity hunt, not trend continuation.
Structural Setup for the Short
Once price taps $149, observe for a sharp rejection or breakdown of internal short-term structure (i.e., break of a local low with displacement).
This signals the smart money exit and bearish intent.
The shift from engineered buy-side pressure into sell-side delivery confirms short bias.
I expect NVDA to run higher into $149 to sweep liquidity, then break down sharply toward $135. I will look for internal bearish structure to form right after the sweep and will short only upon confirmation of intent (displacement and lower low).

NVDA: Fractal Wave BreakdownBreaking above Rounding Top Pattern after rejections.
Wave transformed from pullback to impulsive one, which implies that the emerging structure needs to be routed to relative cycle.
Waveform
Referral structure looks like compressed version of decline after ATH.
As if the movement of big magnitude that pierces through SL levels, causes "shockwaves" that resets frequency of reversals of forthcoming waves.
Fibonacci interconnection of ATH and Bottom

NVDA: Options GEX & Technical Setup for Jun 161️⃣ Options Gamma Insights
* Strongest gamma resistance sits in the 140–145 zone, with a hefty 3rd CALL wall (~79%) and consistent NETGEX/Call shelf near 145.
* IV is ultra low (~6.4 vs avg 46.5), meaning traders benefit from moves more than decay—especially as price nears gamma protection levels.
* GEX exposes (call $5.8 put $94) show mild call skew, favoring small upside tilt.
* Trade idea: Look to buy short-dated (~5DTE) calls or a call spread below 140–142, targeting fade/exercise pressure at 145; or consider put protection if NVDA breaks below 140 with bearish momentum.
2️⃣ 15-Minute Chart Analysis
* Price anchored near top of short-term consolidation range (140–145), after breaking below previous range high. Structure shows lower lows & lower highs → bearish tilt.
* Resistance: 142–145 overhead zone.
* Support: Near 140 (stop level), followed by 137 and previous BOS at ~140.86.
* Trend direction: Downward pullback within afternoon range.
3️⃣ Trade Setup Suggestion
* Bias: Bearish if price fails to reclaim above 142–145 gamma region. Bullish only on reclaim + clear BOS structure.
* Options plays:
* Buy 5DTE–10DTE put spread below 140, targeting 137–135 with tight risk.
* Alternatively, buy call spread if price breaks and holds above 145 with volume.
* Stops & Sizing: Risk 1–2% per trade; place stop-loss just outside your entry trigger zone.
🧠 My thoughts?
* Gamma alignment: Gamma walls act as structural support/resistance—145 is reinforced by call wall.
* Low IV: Minimizes premium decay and makes directional moves more profitable.
* Chart context: Lower-highs structure gives bearish edge; bearish setup aligns with downside call-to-put skew.
🚨 Disclaimer
This is not financial advice. All trades carry risk. Manage position size carefully and be aware that options are risk assets—especially with low IV.
