Oracle ShortLosing business to Amazon. Bearish engulfing daily candle on increasing volume. Broke below 200MA on volume.
ORCL trade ideas


ORCL Needs to Pull BackIn less than 1 month, Oracle has ripped 14% higher with no pull backs in the last 7 trading days. This has reached the prior highs and is due to retrace back down to $48-47.50 at least. This was beaten down for no real reason, but this needs to pull back and find support before it's next leg up.
Heavy on 7/27 $48 puts for a high risk, quick swing trade

ORCL short. Bearish Divergence, overextention.ORCL short position. 8/17 $47 Put purchased. Will close if a 4H candle is looking to make new highs. Bearish Bat as well according to user Finance Rhino

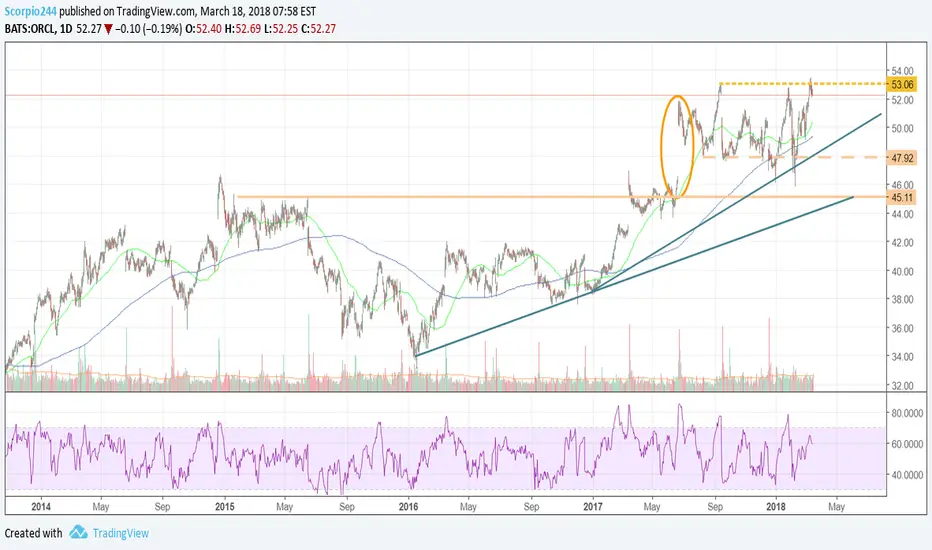
"Trade what you see not what you think" Bullish Sentimentoracle corporation @ all time highs
Important we see a break and close of $47.03 as that will give confirmation of drop to $43.35

Update Final (for now): $ORCL long-term bullishReached the long-term target $46 with a parabolic move. I just STC all my calls. Will definitely buy the dip if this goes back to the red pivot.

ORACLE short to opposing Demand zoneFor Oracle Monthly uptrend was broken so now it is possible to trade short according to Weekly downtrend after price return to Weekly Supply zone, with target to the oppodisng 3 Month Demand zone.
It may be named also as countertrend trading according to 3 Month uptrend.


ORCL short setupPreviously I thought we would be heading directly higher from the 45 bottom. However from how the bottom reaction has evolved, I think we head to 38-41 region first before we can head higher. I will take short positions in the green square labeled c

Update on ORCL, still looking BullishContinue to be bullish on ORCL.
On the daily chart you can see we are testing that resistance around $47.30 but we are creating a nice ascending triangle which is a bullish signal.
We are above the EMA50 but the EMA200 is right overhead ($47.68) and provides major resistance for us to push through. We'll see if the bulls can push us through that this week.

Bullish on Oracle for push back toward $50Some retracement happening from the push to test the resistance at $47.30, I'd like to see us retest support below that again before taking a run towards $50 again. If it tests that resistance again now and then drops, it'll likely go looking for the next support level which looks strong at around $45.50.

COMPARISON/CONTRAST OF FOUR BULLISH TRADES IN ORCLORACLE
The Plain Jane "Spack" (Short Put/Acquire/Cover) Trade
Sell the June 15th 44 put
Metrics:
Probability of Profit: 75%
Max Profit: $69/contract
Max Loss: Undefined
Break Even: $43.31
Delta: 26.48
Theta: 1.17
The Plain Jane Covered Call
Buy Shares at 46.23/Sell the June 15th 48 call
Metrics:
Probability of Profit: 48%
Max Profit: $174
Max Loss: $4626
Break Even: $46.26
Delta: 66.29
Theta: 1.21
The 90/30 Poor Man's*
Buy the Sept 21st 37 long/Sell the June 15th 48 call
Metrics:
Probability of Profit: ~50%
Max Profit: $177
Max Loss: $823
Break Even: $46.23
Delta: 52.50
Theta: .55
* -- The back month bid/ask is wide in the off hours, but I wouldn't want this filled for anything more than a break even at where spot is currently trading.
The At The Money Net Credit Put Diagonal
Buy the Sept 21st 42 long/sell the June 15th 45 short put
Metrics:
Probability of Profit: ~50%
Max Profit: Undefined
Max Loss: $383
Break Even: $45.83
Delta: 21.29
Theta: .54
Comments: One of my frequent primary considerations is how much I want to hang up on the trade in buying power and -- to a certain extent -- that is depending on what kind of environment I'm working in (cash secured versus margin). As you can see, the Plain Jane covered call is quite pricey to put on, and I would probably never choose that option out of the gate because I don't like to buy stock at market: I'd rather sell short puts and get assigned shares that are lower in price and then proceed to cover instead.
Even the "Spack" trade may be pricey for some, depending on the environment in which you're trading; if cash secured, you're going to pay $4331 to put that trade on, although you could buy a cheap, throwaway long put to reduce that buying power effect substantially without giving up much (e.g., the 35 long, which costs .07 to put on at the mid, results in a "definition" of the risk to the width of the spread (9-wide) minus the credit received (.63) or $837 instead of the over $4k you'd be paying to "go naked"). On margin, doing that doesn't get you much in terms of freed up buying power, since you're likely to pay $860 on margin to put the naked on.
Out of all the plays, the net credit diagonal is cheapest to put on, but max profit is unknown since it will depend on how much you get for rolling the short put.
From a max profit standpoint, the Plain Jane covered call and Poor Man's are comparable in pure dollar and cents terms, but return on cap is much higher for the Poor Man's (21.5%) versus the Plain Jane covered call (3.8% cash secured; twice that if on margin). From that standpoint, the naked "Spack" trade is probably the worst if you go undefined in cash secured: a 1.5% return on cap risked, although if it's better if you play it on margin (8.0%) or go with the uber wide spread with the throwaway long, which -- weirdly enough -- almost no one ever does in spite of the fact that it (a) defines the risk; and (b) dramatically improves return on cap ... .
Takeaways: (a) Never covered call out of the gate; short put/acquire/cover instead; (b) there is little to no advantage of going naked over "wide defined" in a cash secured account; buy a cheap throwaway, define your risk, and conserve your buying power over tying up the large notional associated with a full-on naked; (c) Poor Man's have better return on cap metrics than virtually every other play; (d) for uber cheap buying power tie-up in small accounts, go with flexible, at the money net credit diagonal and opt for cost basis reduction with rolls of the short aspect over time.

Oracle - Short Term Bounce but continued downtrendOracle looks set for a little rebound which will test the short-term moving averages and then the longer-term moving averages which I believe it will ultimately fail to break, the market isn't in a position to support that type of move.
The positive news about the lawsuit with Google is a decent catalyst to help the stock recover a little, there may be enough market momentum to rally the stock in out of hours trading but the larger macro movement in the market will undoubtedly lead its real destiny for the moment so Monday's opening will be critical to determining which way to trade this.
Longer timeframes show Oracle is oversold so this helps support the theory of a recovery. If we can break up through $46.50 I believe we could see us reaching $48.50 before continuing the downward trend.
If we failed to break $46.50, that price range many form the neckline of an inverse H&S and support a swing back up toward $48 as the right shoulder forms, we'll wait and see.
Trade safe.

ORACLE shares Buy IdeaORACLE shares Buy Idea @ Monthly Demand Zone (44.70 - 43.48)
Buy Limit: 44.70
Stop Loss: 43.30
Take Profit: 49.53

ORCL = Earnings = BearTimeBest Indicator Is Your Eyes
Price Action Trading of Daily charts will give you the "TRUTH" of any stock or chart. This chart is telling you that when ORCL has earning on 3/19/18, price action will FALL. Price action will probable GAP down too. Don't fight markets or trading train will run you over, instead be on the train. $48 is good support area on chart (red line). In Pre market on Monday, you could sell stocks or look into cash secured put options...Good Luck in trading.

Oracle low and on important suportAfter the earnings, oracle made a big gap downwards. When looking to the charts it tells me that Oracle is at a low, and it should have some upward potential from here.

Neutral double calendar Earnings 49P 56C mar23 mar29www.tradingview.com
Trying out this strategy for earnings tomorrow, when sets up with good IV spread the crush should profit what is typically considered a bought spread.
Direction is not an issue, only that the break-even points are outside of recent earnings moves. This setup goes as wide as possible without letting the belly of the profit/loss go below the trade expenses (commission and fees). This one usually moves so should settle in profit and the cost or max loss is minimal when closed before the short, front week expiration. The intention is to close as soon as the vol crush occurs unless movement is taking it more profitable at the moment.
The main analysis involved is checking the last several earnings moves so that all or most of them are within the break evens of the setup. So it is a sort of trend analysis looking at the trends/history of earnings moves.
This stocks options become reasonably liquid at earnings time so the fills in closing should not kill the trade. I have looked at several of these over the past few weeks and seems clear when good or bad trade. Now to place live trades and get the real learning (in the muscles) by doing. If these work out will post more with clearer entrance guidelines. Hard to find a better probability of profit or reward to risk ratio.
Sunday night parameters:
Stock price 52.27
debit of double calendar spread ~0.12 ($12 per contract) depending on fill
Theta $3.60
break-even points (conservative, actually small profit) ~ 47.50 and 58.50
max loss $12 plus expenses
projected (IV adjusted for post crush) belly of p/l return (zero price movement from earnings) ~ $4
max profit at the strikes of the legs: $43 at 49 strike and $53 at 56 strike

ORACLE SHORT?I believe that short on this stock is probable.
We can see prices depreciate to lows of 51.00 and potentially much lower, prices have reversed on a key level!
The 2.0 retracement might be the catalyst we needed to see prices plummet down to the 49.00 level.
TP: 49.00

