PAYPAL'S Fans, if you love volume this is your game play guys ! I guess everyone is adding this to their portfolio, just look at the volume and how crazy these buyers are entering
at these levels.
PYPL trade ideas

PYPL - One more deep to touch 200 EMALooking for PYPL to go up and down to bounce again at 200 EMA like what it did last March 2020, but will not break the all Time High because of 20MA and 50EMA is sharply pointing down to 200EMA.
Entry: 174.00 or when bounce at 200EMA
SL: 61.8% of Fibonacci Retracement from March 2020 to ATH
TP 1: 23.60% to 38.20%
TP 2: 38.20% to 50%
*

$PYPL - Bottom Is In, Breakout ImminentI posted a $PYPL chart earlier in the week and just wanted to post an update!
We seem to have found a bottom of 179, and are struggling to clear 193, giving us two ways to navigate this trade.
I'll be looking to grab 12/17 190Cs in the event we dip back down to 179, OR 12/17 200Cs if we break 193 to the upside and start aggressively recovering.
Buy the dip or play the breakout, both strategies are valid imo. This ticker is a powder keg waiting to explode.

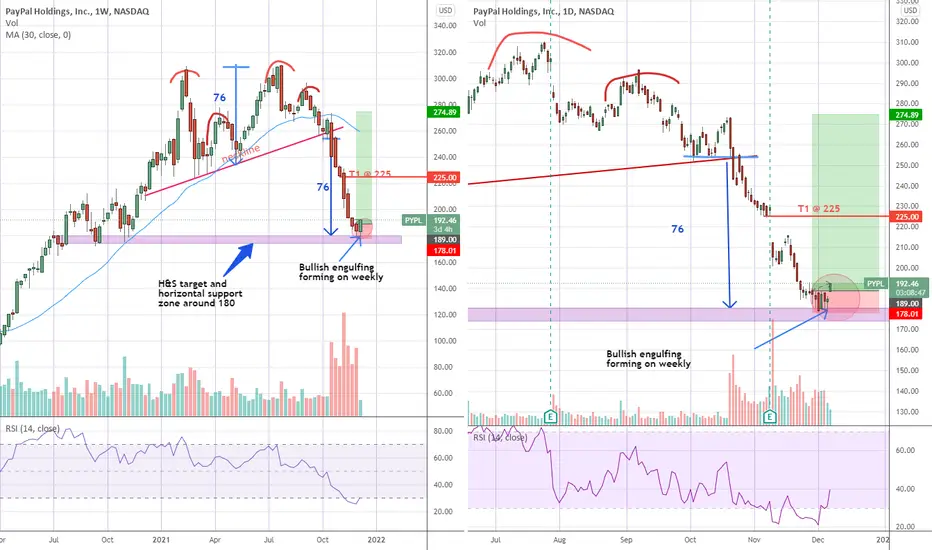
PYPL - could have bottomed outPYPL broke down from a messy Head & Shoulders formation of sorts (head-shoulder-head-shoulder) in Oct and had been trending down strongly since.
It eventually came down to about 180 on 1st Dec last week, which incidentally was it's H&S target and also a possible horizontal support zone here.
However we only see a decisive bounce off this level today, opening with a gap up, leading to the potential formation of a bullish engulfing candle on the weekly timeframe.
With a confluence of factors (H&S target, horizontal suppport and potentially bullish engulfing on weekly), I am fairly optimistic that it could have bottomed out.
I will venture a long today with initial stop stop slightly below $179. Will take partial profits around $225 (a gap fill) and protect remaining positions with trailing stops.
Disclaimer: TA is about improving our odds of a successful trade (not a guarantee). This is just my own analysis and opinion for discussion and is not a trade advice. Kindly do your own due diligence and trade according to your own risk tolerance and don't forget that money management is important! Thank you. Do give me a thumbs up if you agree. Feel free to let me know what you think! :)
PayPal near a strong supportAfter a big decline in PayPal stock price, now it is near a strong support. A clear Divergence sign in RSI and Stochastic is seen. Technically it should fill the gap at around $225.
This is a personal analysis and not for your decision.

$PYPL - Support around $181 or fall through and gap fill?Currently resting on a support area around $181. If current support failed, the stock could drop to $141 which is a gap area it left behind last year. In that case a quick gap fill around $129 is possible.
Bull case - $181 support hold and price consolidate or reverse.
Bear case - the price fall through $181 and fill the gap around $129
Which will it be? Time will tell. Whats lacking right now is clear case of bottoming or reversal pattern. Watching from sideline.
———————————————————
How to read my charts?
- Matching color trend lines shows the pattern. Sometimes a chart can have multiple patterns. Each pattern will have matching color trend lines.
- The yellow horizontal lines shows support and resistance areas.
- Fib lines also shows support and resistance areas.
- The dotted white lines shows price projection for breakout or breakdown target.
Disclaimer: Do your own DD. Not an investment advice.

Pypl Always had bullish every December Pypl should have good earnings on the way that should help another bull run very soon in the next 30 days

$PYPL - Demand Zone BelowI've been eyeing $PYPL for a while now and I think this week will make or break it.
Although we found support right above the demand zone at 179, I believe we may have a kiss more downside left in the tank. I want to see us get to the demand zone before scaling in a position.
If we see 175 and bounce, I'm a buyer. That being said, I will swap to puts if we break to the downside as we've got quite gap to fill below.

PYPL near bottom 12/4/2021When Cramer is pumping, you know it is not the bottom but the bottom is near, like within 15%.
But Cramer pumping will give a short term relieve, so I think PYPL will recover to about $200 then start the next leg down to $150-$160.
I have done some rough evaluation on the incoming/revenue of the company and feel like around $150-$160 is a fair price for PYPL.


PYPL LONG IDEABuy range on PYPL is a great weekly and monthly level to test with easy stop. If the range holds this is a great risk:reward trade.
Enjoy!

$PYPL Is [Paypal -40%] a Great Buy NOW?!By "The Motley Fool"!
I will be talking about PayPal NASDAQ:PYPL and why it might actually be a great stock to pick up during this recent market crash. While being down 40% from its all-time highs, PayPal's business is doing extremely well. You can find the video below, but here are some highlights.
1. Last quarter, the company reported revenue of $6.18 billion, up 13% year over year (YOY), and EPS of $1.11, up 4% YOY.
2. Venmo ended the third quarter with more than 80 million users.
3. PayPal added 13.3 million net new active accounts (NNAs) and ended the quarter with 416 million active accounts.
4. The company announced a partnership with Amazon that will allow its customers in the U.S. to pay through Venmo starting in 2022.
5. PayPal CEO Daniel Schulman recently said that on Black Friday, the volume of buy-now-pay-later transactions was up almost 400% year over year, to around 750,000 transactions in that one day.
6. PayPal ended the quarter with free cash flow of $1.29 billion, up 20%. Over the past four quarters, it generated over $24 billion in revenue, and it is trading at a trailing-12-month revenue multiple of 8.6.
7. The company expects revenue will grow approximately 18%, in the range of $25.3 billion to $25.4 billion, and that it will end the year with more than 430 million active accounts.
8. Price is technically testing a broken wedge that's been extended since Jan 18 and has bounced about 4% so far.
Follow for more similar serious opportunities...
#AHMEDMESBAH

is the bottom finally in?👀 pypl reversal candle and hi🚀her low forming on paypal ! after so much blood the bottom may finally be in for this one! watching for a entry tomorrow.
my price targets are 221.73-276.76
like and follow for more! 💘

pyplHey look at this chart
we near important support line
I suggest you buy and holding for next week

Loading UP PayPalHeavily discounted price for this beauty between 170-180 would be a good buy. no short term target, this is a long term hold, this company can reach 1T market cap in the next couple years.

PYPL worst case scenario I am at 189,80. Hope for a short-term rebound and will probably sell.
Gambled like a chimpanzee. No bueno
