QCOM: TWO WAYS, GAP UP OR GAP DOWN?QCOM has reached a crucial support zone level and seeing it rebounded with a green candle and RSI turning backup to 50, giving more reasons that it might filled the gap up from $142 to $145 easily with nice volume push. Friday closing was beautiful in conjunction with a good volume, seeing more upside if Nasdaq rallies up this week to $152 a strong resistance. Price/Earnings have been clamped down recently and it will be a good growth stock to lookout.
QCOM trade ideas

QCOMsomething to keep on watch here. QCOM got a positive reaction after earnings which sent it flying on a gap up. Friday was an inside day and has a good shot to fill the gap above to $160. Be cautious, as the las two times prior to reaching this level, it sold off hard. Watch the week ahead and an invalidation would be a daily close below $145.
Resistance turn support, bias upside15th Aug 2021
Resistance turn support.
Worth to enter.
TP remain: $160

$QCOM - Sideway trend or Rectangle breakout. Target $165The stock recently broke out from its rectangle.
Target - $165
———————————————————
How to read my charts?
- Matching color trend lines shows the pattern. Sometimes a chart can have multiple patterns. Each pattern will have matching color trend lines.
- The yellow horizontal lines shows support and resistance areas.
- Fib lines also shows support and resistance areas.
- The dotted white lines shows price projection for breakout or breakdown target.
Disclaimer: Do your own DD. Not an investment advice.

QCOM made a double bottom and is now looking to break!QCOM has been doing well fundamentally with its sales growth more than 30% quarter-over-quarter.
Technically it's on a clear up-trend and just recently had a nice pull-back.
Looking at the price-action on the weekly, we can see that it just made a double bottom and is now looking to break.
What makes this more interesting is that the pull-back used the 10-EMA on the monthly time-frame as support and volume is kicking in.
Thoughts:
* QCOM made a double bottom and is now looking to break
* The double bottom will be confirmed if the price breaks and closes above 144.10.
* The measured objective of the pattern would be close to its all-time-highs.
Trade idea:
* Wait for a confirmation of the pattern i.e. wait for a close above $144.10

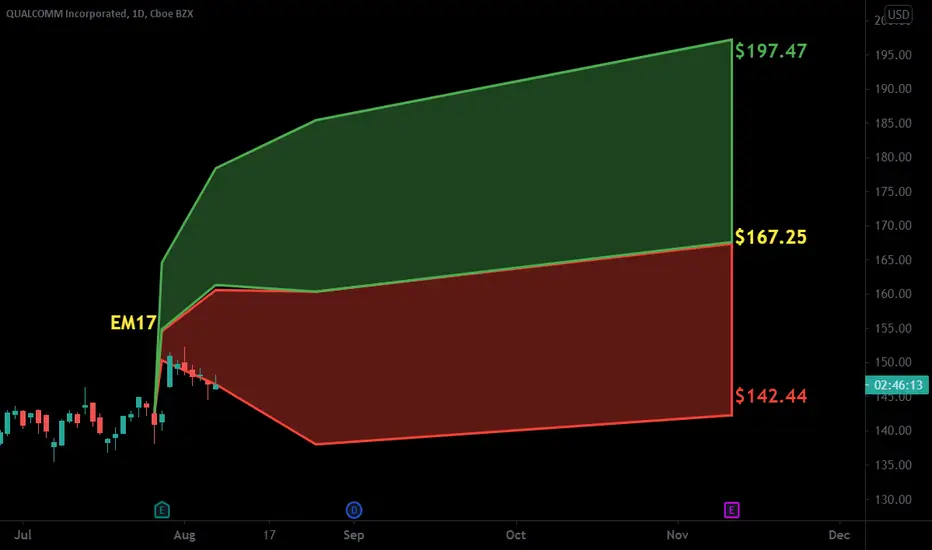
$QCOM with a Bullish outlook following its earnings #Stocks The PEAD projected a Bullish outlook for $QCOM after a Positive Under reaction following its earnings release placing the stock in drift A
If you would like to see the Drift for another stock please message us. Also click on the Like Button if this was useful and follow us or join us.
$QCOM filled gap and made a hammerbullish breakout and retest.
semis have also been breaking out and holding the retest $SMH $SOXL

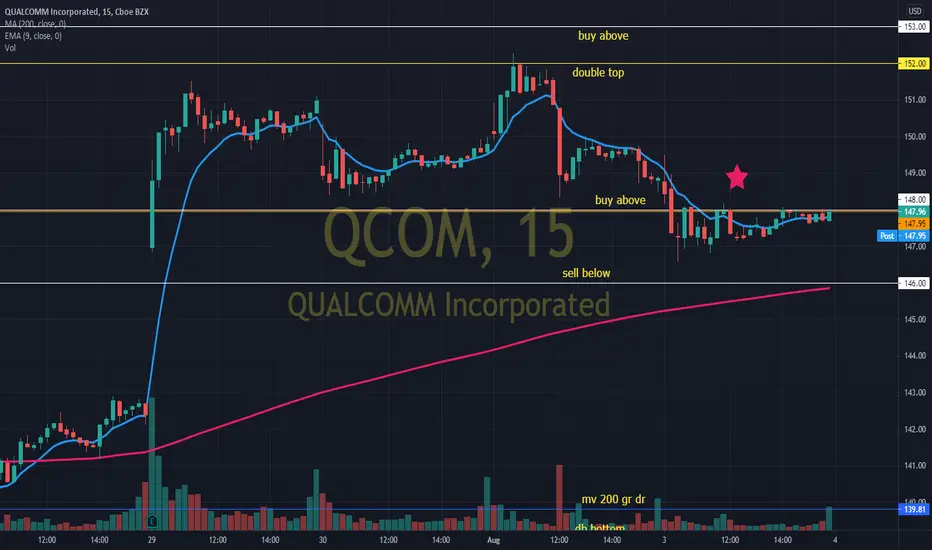
strategy for QCOM WEDNESDAY 08/04/2021(QCOM buy price 148.00 above)
(QCOM sell price 146.00 below)
NOTE: in case of bullish opening we will have a gap and go, our trade exit should be in the double top 152.00 to ensure profit, if it breaks the double top our next entry carefully should be 153.00 always wait for confirmation. reminding you there is a divergence between the 5mn bearish and 15mn bullish charts
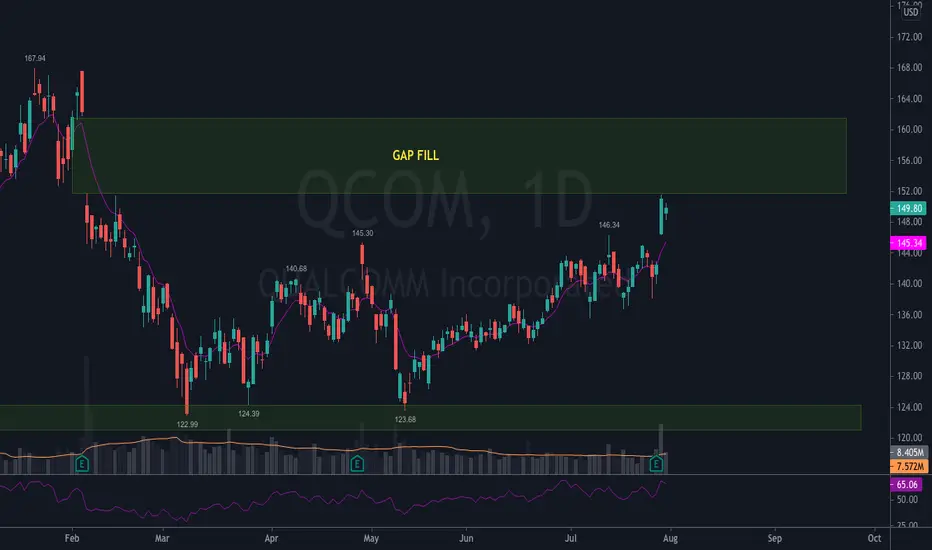
QCOM gap fill playQCOM gapped up from recent earnings and then had an inside day setting up for a big move either up or down. There is an enormous gap above from 152-162 as well as a smaller gap below from 146.50-143.
Considering the volume on the earnings breakout from the ascending triangle, QCOM is leaning more bullish but can be played either direction.
Calls above 152
Puts below 146.50

Ascending parallel Channel On QCOMAscending Parallel Channel on 3 Support and Fibs Retracement on 0.618.then its conform upward

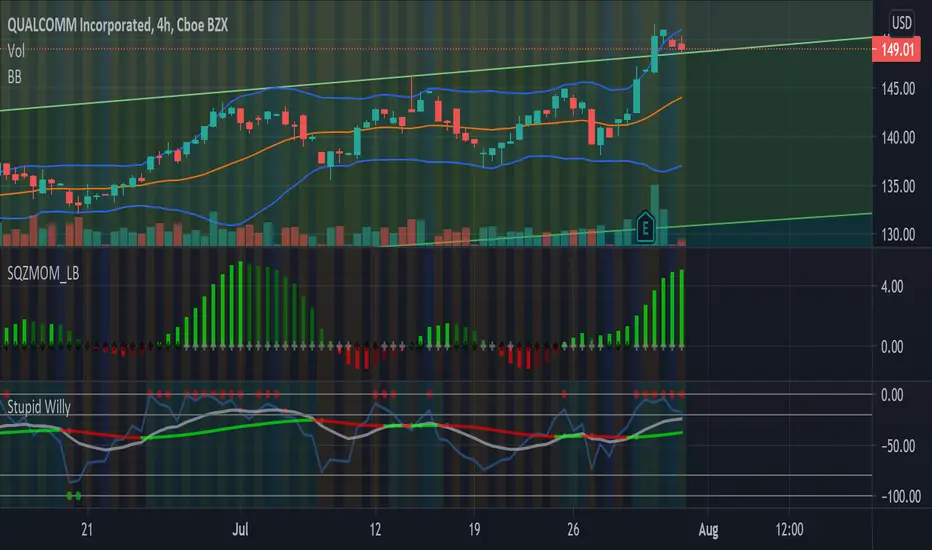
Potential Dip in QCOM(bullish longterm)QCOM has had a significant gap up in price recently which led it to reach the outer Bollinger Band on the 4h chart. This area on the Bollinger Band usually signifies an overbought area. If it passes through Fib Support to the temporary downwards then that is a great indication of a dip buy. Personally if Fibonacci support doesn't hold, I am looking for the 144 for a buy. I see this potential dip as an amazing buy opportunity to look out for.
Bearish Signals
-Over Upper Bollinger Band
Buy Zone
-144
$QCOM in Ascending Triangle $165 PT The global chip shortage is still nowhere near over, making semiconductor companies very attractive here. QCOM is my top pick of the sector as they dont only benefit from the chip shortage they also benefit greatly from the roll out of 5G. The roll out of 5G will be sped up by US investment via the infrastructure bill which allocates $65b to broadband infrastructure. QCOM’s Snapdragon 5G chip is the most cost efficient chip on the market, which should continue to be in high demand as chinese firm Huawei is still banned in the US and UK which creates market share for QCOM given Huawei used to be one of the largest 5G chip manufactures before they were banned in multiple countries. QCOM has been trading in a clear ascending triangle pattern which historically implying further upside (72.7% of the time), QCOM should be able to breakout of this pattern and move higher. Trading at 20x (FWD) PE and a 2% dividend QCOM is trading at a very fair value, with great growth prospects making it a very strong BUY for me.


Descending Triangles do not always break to the downsideDescending Triangles do not always break to the downside, especially in a bull market, but this last week has left a chill in the air. Folks are questioning our future economy, inflation and our current leadership's capabilities to help us out of this hole they appeared to enjoy digging. Well now the hole is there, nice and deep. Are they busy grabbing shovels to fill in this hole? Much of the media has helped dig this deep crater I suppose. So now we are like earthworms ..just dunno.
QCOM seems to follow the Bollinger Bands on the 20 DMA and one may suppose it is not so volatile as to set the bands on an 80 Daily moving average. QCOM seems to play the 20 daily moving average bands which can suggest a lack of extreme volatility. When QCOM has tipped over the top band/DMA 20/ it promptly goes back within the bands. When it breaks the bottom band, QCOM seems to go back inside the bands.
QCOM has pulled back after tipping over the top band, but the bands are contracting.
Contraction can mean a break either way, up or down. And it does appear to be a descending triangle. Tough one. Double bottom with almost a triple bottom so it appears the bulls will not let price go lower than this, for now anyway. I see support above the bottoms but we all know support levels can be broken.
I own this so I hope not. I do not think Mr. Market cares what I hope though )o: There is just no way to know for sure, but I put the targets up anyway...lol..I may be sorry. Use your own judgement on this one, and a conservative trader may wait for a break closer to the bottoms. A short trader may be banking on this to go below the bottoms or to the prior bottom. Short interest is very low. Negative volume is very high.
I am positive on QCOM even though what I wrote sounds a bit dismal. I just have the feeling everything may be a struggle for a while, so I am digging in on stocks I believe in with decent dividends. Monday may be a sunny Monday (o:
A break of the top trendline can be a bullish signal. QCOM has struggled there for a few days. It is amazing how support and resistance really do exist, almost like concrete sometimes. I have learned not to ignore S&R levels from many years ago, as they can come back to haunt you.
If this does break the top trendline of the triangle, there needs to be a confirmed uptrend.
No recommendation

Pre earnings trade QCOMLooks like QCOM is providing good financial results while this triangle has been built. Let's see if the current resistance could be broken and the bullish trend can continue

$QCOM - Rectangle breakout watch Has been consolidating inside a rectangle.
Break out point - 145
Good case - $151
Best case - $164
Bad case - $132.50
———————————————————
How to read my charts?
- Matching color trend lines shows the pattern. Sometimes a chart can have multiple patterns. Each pattern will have matching color trend lines.
- The yellow horizontal lines shows support and resistance areas.
- Fib lines also shows support and resistance areas.
- The dotted white lines shows price projection for breakout or breakdown target.
Disclaimer: Do your own DD. Not an investment advice.

QCOM Bull Run to 160QCOM displayed a time of consolidation on the weekly time frame which was the first indication of a major move. A confirmation towards this idea was given by the MACD as seen by it crossing the Signal line(increase in bullish momentum). The Daily time frame is also resting at its Fibonacci support allowing for a great entry. My price target for this stock is 160 due to the Fibonacci resistance resting there.
Although I am bullish on QCOM remember that Jerome Powell will be speaking this week, which may result in a more volatile market.

QCOM Quarterly 2-1-2 ReversalEntry and profit targets shown in purple, stops in red. Looking for a solid close over 145.30 to bring the quarterly 2-1-2 into play. Wait for confirmation through price action, you can see it already tried to break once and failed.

Breakout play. Target 160 gap play25th July
Break above 145 may see 160 next level.
Possible to cover the gap.

QCOM Trading Idea- forming double bottom but not complete yet
- wait until it BO $145
- then follow trend or TP at any resistance you like.
- for short term plan, advised to EP after earning.

Cup and handle formation on Qual CommLooks as if Qual comm has formed a bullish cup and handle. Trade long for the 153 price level resistance denoted by the orange line. Safe bet is to trade the break out. If you are risk tolerant, the handle may still yet have formed be careful (tight stop loss).

QCOM is in an uptrendQCOM is in an uptrend.
As long he is making higher highs and higher lows this uptrend stay active!
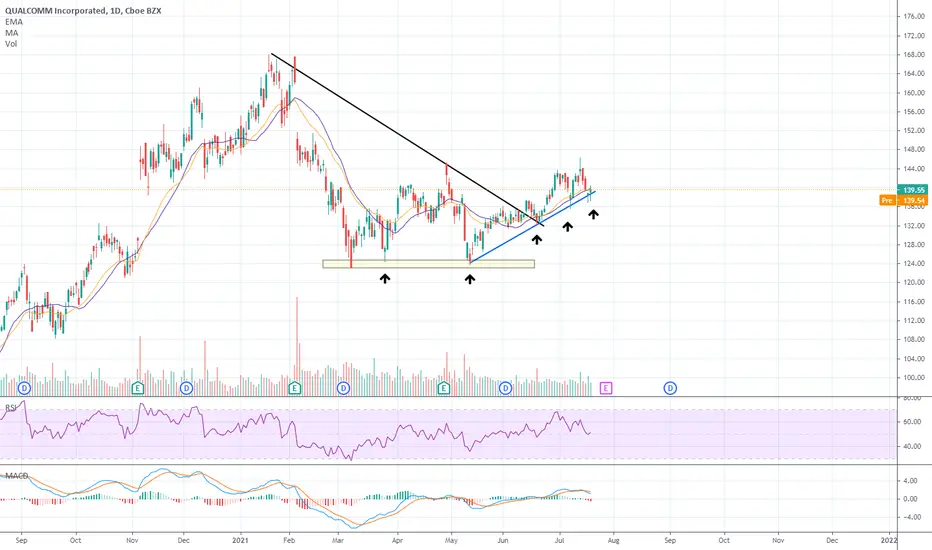
Qcom back to 123Supply area rejection. currently sitting on 200ma, targets after that is 50ma and 100 ma at 135. Fib support at 132, a break below 132 will lead to the eventual 123.
Soxl chip sector has been weak ever since the distribution has started with NVDA.
Macd -Death cross
A break in that white trendline is a double top
