QQQ trade ideas

QQQ Intraday $100 to $2500 with options RECAPQQQ is shown here on the 15 minute time frame. Overlaid are a HMA 7 and SMA 5 to provide
moving average crosses. QQQ made a "M" pattern. Options charts are shown in the updates.
First Trade SQQQ is opened at 9:48 for $ 6.00 per call contract times 16 contracts. It is closed
at 10:05 less than 20 minutes later at $20.00 per contract. $96 dollars the only risk in the trade
is waiting to settle as is the $ 224.00 in profit. ( This is a same day expiration intraday trade)
Second Trade QQQ as QQQ has topped and is pivoting down. The second trade of the day
is not a same day expiration as it is now Friday afternoon, a put option in the direction of the
trend is taken for Tuesday the 20th, there being no puts for the Monday holiday.
The floating profit is $ 224 and the strike is set for below the money in the current direction of
the trend. A strike of $ 429 selected. The options chart is shown in the updates.
The premium was 0.37 so $37 per contract so six contracts were taken for a total of
which is $222 or slightly less than the profit on the first trade. The trade is taken at 14:47
market time and closed about 90 minutes later at 15:52 before the close.
The contracts sold at close for $ 1.41 each yielding $ 141 per contract or $ 2256 overall.
Between the two trades $100 was risked and $ 233 + 2256 or 2489 overall.
The Reward to Risk ratio was about 25. The profit and the initial $100 into the trades
awaits settlement after the holiday.
This trade was made to teach a mentee about the power of options leveraged with narrow
expirations to optimize profits and not spend a lot of time in the trade to minimize risk
in the market from any number of potentials. Alerts and notifications centered on moving
averages and rise or fall of intraday low time frame relative strength are used to lessen
screen time. Twenty baggers may not be everyday but then again with practice and patience
they can come along often enough.

QQQ rangbound bearish bias SHORTQQQ on the daily chart hit a hpivot high on 3/21 followed by a slight downtrend of 1-1.5 %
overall this past week. Buying volumes are low. The Price Momentum Oscillator has
reversed to bearish and the Raltive Trend Index has entered the chop zone and is heading
bearish. Price is presently one standard deviation above the intermediate-term anchored
VWAP. Reversion to the mean suggests another 1% move downside before VWAP support
exerts itself. Price is compressing in a symmetrical triangle. Accordingly, I am expecting
a move down before a potential reversal in a VWAP bounce from that support.

CRASH!?Potential 20% further downdraw from here. When you have a well defined channel and you break above and fail. There is good odds you will test the other side of the channel. Not saying it will happen but it is something I am preparing for. The groundwork is there with potential rate cuts (Historically bearish) and recession fears acting as a potential catalyst in the coming weeks/months. That being said there will be opportunities to buy the dip here and if you DCA the end of the week should be a good time to start

I am a buyer on new lows 473/470The chart posted is the QQQ I sold all longs yesterday into the 483.8 as we formed a abc x abc into fib relationship The drop is that of two wave counts first is a wave B low today in the 473 area or wave 5 to a target 470.8 both wave counts are not overly bearish . and worth a trade of 35 % to 40 % long calls again march and june 2025 for good reason . I maintain longs only in MSFT now BUT WILL BUY into this drop in the zone BITCOIN should see a 70k print now as well Best of trades WAVETIMER


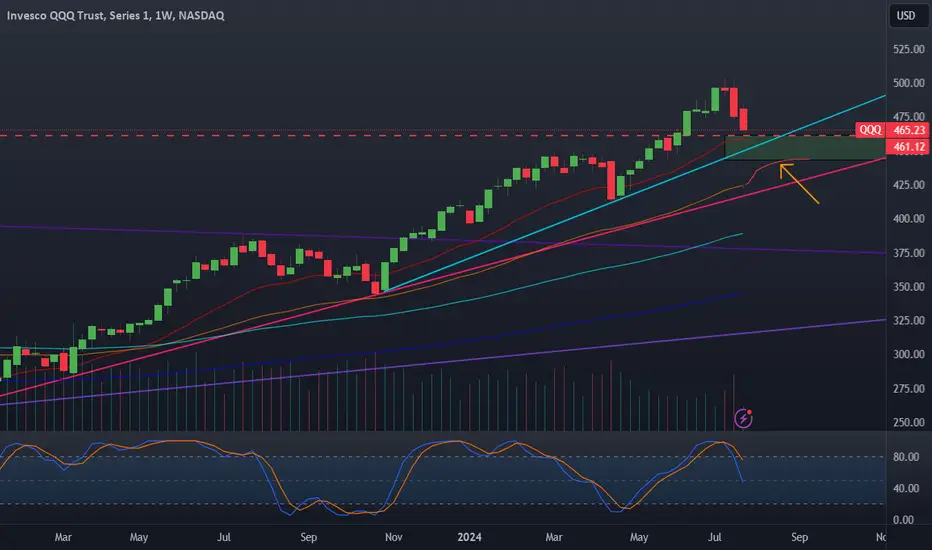
$QQQ - Could check back the trendlineNASDAQ:QQQ could see further decline into the $454 - $450 area to check back on the trendline started back in October 2023. It is also the 10% drawdown area from its all-time high. 👀

educated guess for Pivot Points, tomorrowPrice has to get back inside the PP Range, fact. All we need for that to happen is about a .236 fib retracement.
The white lines, on top of the blue fib retracement are where i think S6 and r6 will be tomorrow. an educated guess.
30 years of watching price go from extreme to extreme tells me we are oversold, the rubberband is wound too tight, VAWP and P. P. by tomorrow, this is just my opinion of course.

Perfect 5 wave impulseThe move up was a perfect 5 wave impulse, so it looks like we are in for a 3 wave correction

QQQ approaches downside targetFinally QQQ has had a meaningful and rather rapid correction. I have been calling for 460ish for a while and have avoided adding to majors that arent tied to option selling. I took this opportunity to add a hefty position to amazon in the long-term spot account.
-If this teal line doesnt hold we will drop to the prior red trend.
-I think we definitely see some action in the demand zone box, possible a flash below to the 50 ema around 440$
-The quicker this happens, the quicker we are to base and then recover
-If this correction is drawn out we will have a pretty lousy August until a rally in late Sept.
QQQ Short TargetToday is quite bearish with VX moving up over 10% and many uptrends being broken. NQ is sitting at demand now, it may hold, but I think I'll wait before trying any longs. I used this are to take profit on shorts for now. If QQQ continues lower, I'd expect it to hit $460 soon and that could be a potential bottom for a while. Many supports are being broken, NVDA and pretty much all of the mag 7 have broken major levels and have not held any support yet.
It's a dangerous time for dip buying and I'd be careful.

$QQQ to bottom sub $250?QQQ had an impressive run, however, that run is now over and it's time to look at shorting this thing back into the ground.
As you can see, momentum has already flipped negative w/ the first red weekly heikin ashi candle.
I expect a sharp pullback here into the election and I think we'll bottom under the $250 sometime before the end of the year.
Let's see how it plays out.

Green week coming?I'm buying some calls here, strike 480 expire 07/26. I think we will have a green week ahead.

07/24 QQQ ATR levels and RangeQQQ ATR 6.11 has decreased over last week.
Fear and Greed indicator is at 54, a little higher than the neutral that we ended the week on last week.
Still alot of uncertainty in the world, foreign administration speaking today.
9:45 we got a couple market moving reports, Positive Impact (PMI > 50): Negative Impact (PMI < 50) for the past few months weve been over the 50s.
We need to hold the 473 level for sure for a bounce of any kind.
If we cant hold that, then we move to 465/464 area as low as 462.
If we can defend 473 area than we move back through the 474.90 zone and wrestle with the low 476.
nothing is set in stone and anything can happen. These are just using previous areas we have visited in the past since we are well below all-time highs.

QQQ H& S Pattern breakdown possible , US ETF474 below Trendline breakdown possible 472/470/460 can test soon
Also have H& S pattern which have target 440

Bearish Formation QQQ to $454.85 or $436.57but B wave up first to fill the gap. TP's in blue for both the small B wave up, and the big C wave down after
There are 4 possible B wave levels we have reached the first one, so we could just go straight down

$QQQ Nasdaq with Rate Hiking Cycle DatesGoing along with my usual 'Key Hidden Levels' in the markets perspective that NEWS is an important price level to mark on charts so it is visible to everyone, I have created the update to the "Rate Hiking Cycle" chart.
The purple triangles and lines are the range of the day of the announcement and the mid-point of the day plotted horizontally forward.
With this data you can see how past levels where the Fed Rate Decision occurred has provided either support or resistance to the movement of the market. Typically it hasn't been as obvious the the observer of a chart all by itself without these markings.
At some point these important news levels will be visible for all of us investors so we can see and understand more quickly how the market is absorbing or dealing with the news.
I hope you enjoy this chart an continue to update it for yourself. I will work to get these dates into the system so you can all see them on every chart.
Wishing you all the best in your investing and trading.
Tim
1:48PM, Thursday May 23, 2024

QQQ: Bullish Reaction Above Critical Support Level.On the daily chart, QQQ has established a critical support line at 476.26. This support level has held the price in the past, making it a key level to watch now. The recent price action shows a pullback from recent highs, testing this support line. The 21-day EMA was lost, and now it is a resistance level. To reverse the mid-term bearish sentiment, the QQQ needs to trade above this 21-day EMA again.
The weekly chart presents an evening star pattern, a bearish reversal pattern indicating potential weakness ahead. The evening star consists of a strong uptrend followed by a small-bodied candle and a subsequent strong bearish candle. This pattern is formed at the end of an uptrend, suggesting that the bulls are losing momentum. The key level of 476.26 on the daily chart aligns with the recent pullback seen on the weekly chart, adding significance to this support zone.
Today's reaction is promising, but the QQQ needs to break its 21-day EMA resistance, and make a clear bullish signal in order to frustrate the bearish signal seen on the weekly chart (evening star pattern). Otherwise, we can expect a pullback on the weekly chart.
In summary, QQQ is at a pivotal point with the critical support line at 476.26 being the focal point. The price action in the coming days will determine whether this support can hold and provide a foundation for a rebound, or if the evening star pattern on the weekly chart will lead to further downside pressure. The interplay between the daily support and the weekly bearish pattern will be crucial for us to watch.
This week is the start of earnings season, so we can expect high volatility.
For more detailed technical analyses and insights like this, be sure to follow my account. Your support helps me continue providing valuable content to help you make informed trading decisions.
Remember, real trading is reactive, not predictive, so let's stay focused on the key points described above and only trade when there is confirmation.
“To anticipate the market is to gamble. To be patient and react only when the market gives the signal is to speculate.” — Jesse Lauriston Livermore
All the best,
Nathan.

QQQ My Opinion! BUY!
My dear friends,
My technical analysis for QQQ is below:
The market is trading on 475.22 pivot level.
Bias - Bullish
Technical Indicators: Both Super Trend & Pivot HL indicate a highly probable Bullish continuation.
Target - 487.32
About Used Indicators:
A pivot point is a technical analysis indicator, or calculations, used to determine the overall trend of the market over different time frames.
———————————
WISH YOU ALL LUCK

07/22 QQQ ATR Levels and RangeThe ATR of the Q's continue to get larger, again this could and very well is a cause of the downside action, it still calculates into the ATR regardless.
We got a clustering of price action below where we currently are something I am looking at for a bounce range.
Lots of geopolitical news out this weekend and as usual the market is in FUD mode.
And the CNN GnF meter is showing NEUTRAL !!!
Good luck

QQQ PossibilityGuessing the price action coming next week..
We are in a strong bull trend. Not expecting everything to crash at one.
My play this week is to scalp some calls as i see some support down at 472-474.

#QQQ-Major Supports under the knees of the market.#QQQ - Time: H4
$465
$445
are the major supports under the knees of the market.

QQQ to more downside?My prediction if QQQ breaks into a downtrend instead of bouncing / consolidating and moving up
