QQQ: Weak Market & Bearish Forecast
The recent price action on the QQQ pair was keeping me on the fence, however, my bias is slowly but surely changing into the bearish one and I think we will see the price go down.
❤️ Please, support our work with like & comment! ❤️
QQQ trade ideas

AI Bubble grows above resistance for QQQThe gap up and follow through today shows a clear break above the 2010 trading channel that has provide resistance so far. I see a pattern very close to that of July 6, 2020. The is not confirmation yet that price is out of the channel and that resistance has become support, but for the bulls this is a very good start. I would expect the bulls to try and run with it now that price is above the channel. I will also be watching for a pullback to test for support in the near future. If that can hold, the AI bubble may get really pumped. We can never know what will spook the market, but right now it feels like the sky is the limit.
Today
July 6, 2020

Did I say $500? Yeah i said it and I'm doubling down!Right now I'm cash but monday looks to be real interesting. Prepping for gap scenarios and key levels.

QQQ ATR LEVELSATR range for QQQ is sitting at and around 5.12
Looking for these lines to come into play with volume and price action.
Technical indicators would be a bonus. Lots of profit gonna get taken out of the market today, thats my opinion, may seem bearish, but I think its just profit taking.

WHERE IS QQQ HEADED?If we form a new high we could see qqq head to 495 by next week. If we reject off the 491 area we can drop back down to 487-488 level. Then if this happens an we see a bullish reaction at this level I say we push back up towards 491 an break past to 495. A true short term bearish structure to occur we must see a break below 483.

QQQ update 7/4D:
Sentiment: Above Neutral
Trend: up
Flow: N/A
Support: 485 b\o resistance turned support test/ 480 UTL
Resistance: 500 psych/UTL
4hr:
Sentiment: Bearish
Trend: up
Support: 480
Resistance: 500
1hr:
Sentiment: above neutral
Trend: up
Support: 485
Resistance: 492 UTL
Analysis:
Sentiment not much of a factor here considering that we can stay hot longer than expected and other than 4hr others are above neutral. NFP expected to be + for tech in theory (or at least the bar is higher for a negative reaction) and that fresh breakout on daily can have more legs to that 500 area before pullback. Personally I’d like to see a retest of the b/o spot at 485 before taking a long but all depends on reaction.

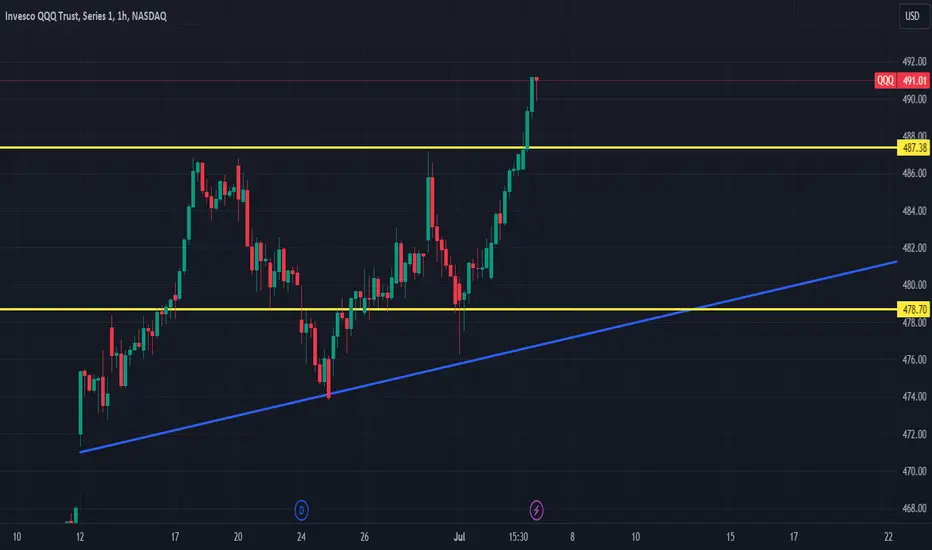
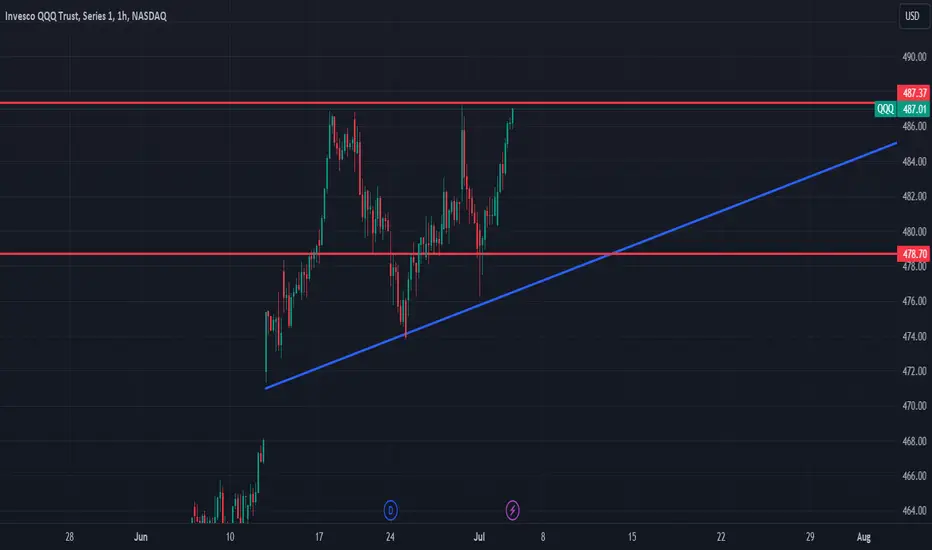
Happy 4th of July QQQ Thoughts Looking at QQQ attempting to cool off from this Summer Heat.
Was expecting a lot more movement from QQQ yesterday, holidays could have slowed that momentum maybe.
Friday looking for a higher high and higher low, ideal outcome is previous resistance (yellow lines) turn into new support and we bounce to that higher high.
Appreciate the read and drop a comment if you agree or disagree!
QQQ - Trade UpdateCurrently I am short 200 shares of QQQ as the 480 calls expired worthless last Friday. Though the market is attempting to rally here IMO this is a fake out to get rid of shorts.
So if you took the swing trade the stop is at 490.50 which we are just short of. If you took the position trade, we are still a good ways off of 502.
Let the trade play out is generally the best thing to do. I am personally building a short position up in this market to hedge my portfolio so I do not mind adding to my position here. There are various strategies which all depend on your situation.
If you are a swing trader, well you are close to getting stopped out here. If you want to limit the loss IF we hit the stop, in lieu of closing it out you could sell a Call, slightly ITM for Friday and let that pull you out, or simply just let the stop take you out.
I like selling options against long and short positions, it won't make you rich, but you can nickel and dime a few extra bones here and there.
If you are in the position trade, then nothing to do here but let the market play out.
Now since I am hedging against my portfolio, I am looking to sell another Call to add to my short position. Again I am hedging my portfolio and building a short position.
Simply too much uncertainty geo-politically after that debacle of a debate. So I want to be hedged short and simple.
There is also a potential UVXY trade I am looking at for the weekend, and I will post on that if and when I add a trade.
Have a blessed Fourth for my American friends, and the rest of you enjoy the week.

Analyzing the Recent Performance of Invesco QQQ Trust (QQQ)The monthly chart of Invesco QQQ Trust (QQQ) reveals some intriguing patterns and insights into its recent performance. Here’s a breakdown of what the chart illustrates:
Strong Recovery Post-Downturn:
From the high in late 2021 to the low in late 2022, QQQ experienced a significant decline of approximately 37.96%, shedding over 154 points in a span of 11 months (336 days).
However, since hitting that low, QQQ has shown a robust recovery, marked by a consistent upward trajectory that has continued into mid-2024. The price has risen above the 9-month Simple Moving Average (SMA) of 438.02 USD, indicating a strong bullish trend.
Key Support and Resistance Levels:
The 438.02 USD level, marked by the 9-month SMA, now acts as a key support level. As long as the price stays above this line, the bullish sentiment is likely to prevail.
The recent high of 489.40 USD represents a significant resistance level that traders will be watching closely.
RSI Analysis:
The Relative Strength Index (RSI) is currently at 72.69, which is above the 70 level, indicating that QQQ is in overbought territory. This could suggest a potential pullback or consolidation in the near term.
The RSI has maintained an upward trend, reflecting the strengthening momentum in QQQ’s price movement.
Volume Trends:
The volume over the downturn period was substantial (17.005B), indicating heavy trading activity, possibly driven by panic selling and subsequent accumulation.
Summary
The QQQ has shown impressive resilience, recovering from a steep decline in 2021-2022 to reach new highs in 2024. The current bullish trend is supported by strong price action above the 9-month SMA and positive RSI momentum. However, with the RSI in overbought territory, investors should be cautious of potential short-term corrections. Key levels to watch are the support at 438.02 USD and the resistance at 489.40 USD.
Investment Insights:
Bullish Perspective: As long as QQQ stays above the 9-month SMA, it remains in a strong uptrend, making it a favorable candidate for long positions.
Bearish Perspective: With the RSI indicating overbought conditions, traders should watch for signs of a reversal or consolidation, particularly if the price fails to sustain above the recent highs.
Stay tuned for more updates and analysis on QQQ and other major indices!
Disclaimer: This analysis is for informational purposes only and should not be considered financial advice. Always conduct your own research or consult with a financial advisor before making investment decisions.

SPY/QQQ Plan Your Trade For July 3 - Early ConsolidationGood morning,
This continued video series highlights my SPY Cycle Patterns and attempts to teach you how to read these patterns and the price charts to plan your trades throughout the day.
Remember, I'm only looking for the best opportunities for trading profits. I plan to avoid any CHOP or sideways price action as it is not my style to scalp in and out of trades every 10 minutes.
I expect the upward price trend to continue, but it will happen later in the trading day (after Noon ET).
I expect the SPY/QQQ to consolidate in the early portion of the trading day - moving sideways and possibly pulling downward after yesterday's strong rally.
I believe that the price must attempt to consolidate into the channels related to momentum; then, the price may try to resume another momentum move higher.
So, I'm going to be patiently waiting out the first 2.5 hours of the trading day, looking for opportunities to buy into lower prices near 11-12 Noon ET, and expecting the markets to move into a momentum trend higher.
What I do may be different from what you decide to do as a trader. I'm just trying to help you see and plan for opportunities throughout the day.
Remember, Friday should be a very large price range day with a Momentum Rally pattern. It is not uncommon for that pattern's momentum to bleed into the end of today's trading day.
It should be a good day for traders.
Get some.

QQQ Breakout above 500 tomorrow? QQQ is crushing right now, waiting for a retest. Looking for a breakout above 500 and a close above 500 for QQQ on the hour, Tesla keeps up this momentum we go higher into the holidays and maybe come back down to the 483-489.
Wave D ?????the chart post could be in a wave D rally I can say honestly NOT SURE but I have taken PROFITS AGAIN $$

Small caps will likely outperform NDX in coming years 2025-2028I have chastised small cap analysts and FURUs over many years for their propensity to lure investors into smaller names vs large cap tech because the overall market is bullish and higher beta smaller stocks should outperform.
They haven't. As my chart clearly shows it's been one way traffic for the last 22 years since the lows following the bursting of the dotcom bubble.
BUT.
I can see some light at the end of the tunnel for small caps - maybe not until later this year or in 2025 (or maybe once the FED criminals start to cut rates). Interestingly the last time small caps outperformed tech was in the 2000-2003 bear market era. So If my analysis is anywhere near correct then what may be good news for small caps (on a relative basis) may not be great for the wider market.
Caveat emptor.


QQQ Short IdeaQQQ recently broke below a small bear flag and now it is nearing a retest. I'll look for puts if it hits. Will need to have a tight stop due to the conditions. Holiday week and TNX is rocketing so kind of scary. However, VX is making new all time lows today so we have some conflicting signals.

Market Update - 6/30/2024In short:
• breadth is improving
• small caps are leading
• lots of setups and the numer increased from the last weeks
• the list of breakouts is expanding each week - there is follow through coming in
• supportive economic data this week

Overall bullish, expecting over $500 in 2 monthsThis video is for level considerations. Trades based on these levels are contingent upon your risk tolerance. If it gaps up on Monday I'm bullish on any pullback but that's considering the prior high of the day was surpassed otherwise I'll be positioned as a bear until the gap fills. I'm open to conversation and feedback. Let me know what you think. :)

QQQ : Heading into smaller correction territoryQQQ : Heading into smaller correction territory
$470-$480 ( lower 470 ) - 1st week
$460-$470 ( lower 470 ) - 2nd week
$450-$460 ( lower 470 ) - 3rd week
$440-$450 ( lower 470 ) - 4th week

QQQ: First week of JulyLooking at this, looks like we could see a continuation of pullback. No huge amounts of short interest for next week after the squeeze we saw this week, so that generally is when the market decides to actually pullback.
Levels to watch are in the chart.
Most likely high is 484 and most likely low is 475.
Purple boxes represent max high and low ranges.
Bias remains overall to the upside in the long term but caution is merited into next week of a continuation of pullback.

QQQ - Trade Update - Biden Wins Debate According to the ExpertsLOL as I mentioned the other day, if Biden wins the debate the market will pullback, if Trump wins, expect a fake rally and then a pullback. So with probably the worst showing of any presidential candidate in any debate, we got our fake rally and now it is time for the pullback.
Here I am looking at the daily chart and the pinbar forming is telling that there simply are no buyers at these levels. Sellers have control of the market above 485.
Now though we are a little in the red on our trade, I am not at all worried here.
1) We have a stop level to minimize losses.
2) The market is at a level where a 5-10% pullback is likely. (better than 50%)
3) Biden was so bad, it is throwing even more uncertainty into the markets.
So as I posted:
I am short 100 QQQ's outright (I may add to that position) and I am just holding here, not worried about the little bounce out of the gate this morning.
I am also:
short one 28JUN 476 C As it stands I am down $85 in this trade
short one 28JUN 480 C As it stands I am up $82 in this trade
So what do I do with these?
Well it is getting close to the close so I can do one of the following:
1) Roll it out another week
2) close them out
3) Take assignment of the contract (which would be acquiring a short position of 100 shares per contract)
There are some other strategies I could employ but these are the basic ones.
If I roll out the 476 Call I am only going to collect another 36 cents on this contract so I am going to let the contract be assigned and I may near the close sell a PUT for next week against this short. I may also just keep the position.
If I roll out the 480 I will collect another $1. That may be worth it and I will likely roll this out if it is still slightly ITM.
I will update around 3:45
So that is my strategy here, Unlike many guys throwing out signals, these are real trades I take in my real account. Not like those "fake gurus" who need mom to sign for the lease on their car and don't even have a trading account more than $5k.
Have a blessed weekend and good luck trading. Will update BTC also.

Nasdaq is gonna crash in the next two weeks! SAME PATTERN!CAUTION: AWESOME OPTIONS PLAYS AT THE END OF THE POST! NFA ;-)
Look at this weekly chart and don't tell me that this is a repeating fractal!? The same color trend lines are almost the same length to a T. The upper trend line channels are gonna be the same distance, which extrapolates this going south for a very long time. (check out my AMEX:SILJ thread to show the repeating fractal line up)
Now of course these lines aren't gonna be what happens, you can see there was some out of the ordinary channel reactions on the downtrend last time.
I personally think that Biden is gonna mess up the debate, then pardon his son and leave the presidency while Kamala will tap Hillary Clinton as VP (via Ford Agnew redux) and then pardon Biden for any crimes done in office or out of office.
The markets will melt down, the FED will cut rates, maybe by 250 basis points since they keep going larger with their reactions to contain the ponzi scheme.
I'd buy puts right now, 400 December Puts for 4.10, sell them for 5x for a nice Christmas/New Year's present.
OR you can go the supersize route and buy puts on TQQQ for 42$ for the $25 strike price (it'll go lower imo) for a 25x return, if the price goes down to $15, that's around a 4200% return!! NFA ;-)
Also this shows the road forward, via a Livermore Accumulation Pattern. So we go very UP for the long term.

QQQ: Key Levels and Potential Scenarios (D&W charts).Daily Chart:
On the daily chart, QQQ has recently hit an all-time high of 486.86, marking a significant resistance level. This milestone suggests a bullish momentum, but it's essential to watch how the price behaves around this level.
There's also a noticeable gap at 468.14, which often acts as a magnet for price action, serving either as support or resistance. Currently, the price is hovering around the 473.82 support level, which, if maintained, could signal continued bullish momentum.
Additionally, the 21-day EMA is another critical support level; staying above it would further validate the uptrend. Should the price break above the all-time high, we could see new peaks. Conversely, losing support at 473.82 might lead to a sharper pullback, potentially down to 460.58 or even 449.34.
Weekly Chart:
Looking at the weekly chart, a shooting star pattern has emerged, typically a bearish signal suggesting a potential reversal. This pattern indicates that despite reaching new highs, there was significant selling pressure, hinting at a possible decline.
The 21-week EMA, however, shows that the longer-term trend remains bullish as the price is still well above this level. If the price confirms the shooting star by dropping in the following weeks, it might signal a deeper correction.
Maintaining above the 21-week EMA would still suggest a strong underlying bullish trend, despite short-term bearish signals.
Conclusion:
In conclusion, while the QQQ shows strong bullish signals, indicated by new all-time highs and support levels on the daily chart, the shooting star pattern on the weekly chart warrants caution.
If the price holds above 473.82 and the 21-day EMA, the bullish trend is likely to continue with potential for new highs. However, if these supports fail, we might see a correction down to the gap at 468.14 or lower. Overall, monitoring these key levels will be crucial in determining whether the QQQ continues its upward trajectory or enters a period of correction.
For more detailed technical analyses and insights like this, be sure to follow my account. Your support helps me continue providing valuable content to help you make informed trading decisions.
Remember, real trading is reactive, not predictive, so let's stay focused on the key points described above and only trade when there is confirmation.
“To anticipate the market is to gamble. To be patient and react only when the market gives the signal is to speculate.” — Jesse Lauriston Livermore
All the best,
Nathan.

QQQ What Next? SELL!
My dear subscribers,
This is my opinion on the QQQ next move:
The instrument tests an important psychological level 480.05
Bias - Bearish
Technical Indicators: Supper Trend gives a precise Bearish signal, while Pivot Point HL predicts price changes and potential reversals in the market.
Target - 463.65
My Stop Loss - 489.72
About Used Indicators:
On the subsequent day, trading above the pivot point is thought to indicate ongoing bullish sentiment, while trading below the pivot point indicates bearish sentiment.
———————————
WISH YOU ALL LUCK
